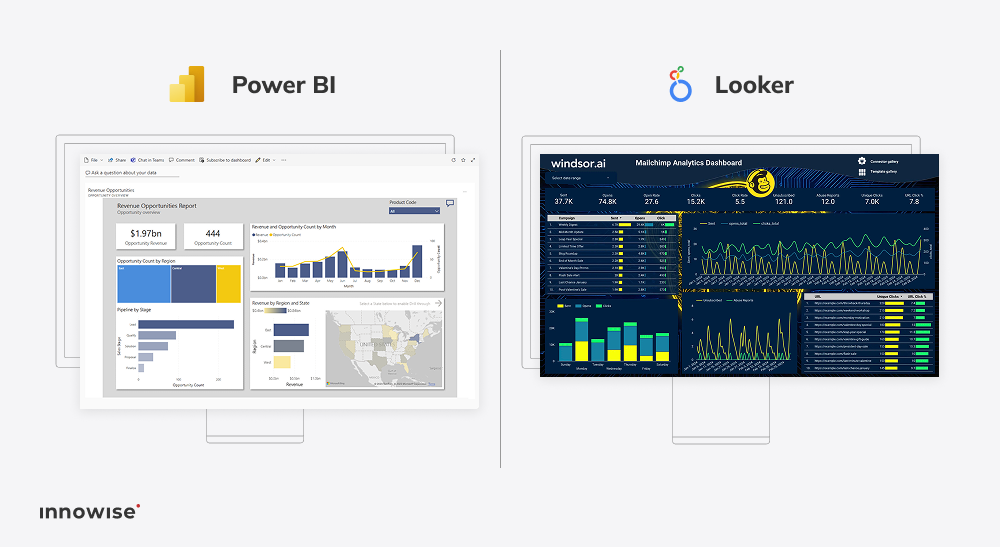
O poder da cartografia de dados nos cuidados de saúde: benefícios, casos de utilização e tendências futuras. À medida que o sector dos cuidados de saúde e as suas tecnologias de apoio se expandem rapidamente, é gerada uma quantidade imensa de dados e informações. As estatísticas mostram que cerca de 30% do volume mundial de dados é atribuído ao sector dos cuidados de saúde, com uma taxa de crescimento prevista de quase 36% até 2025. Isto indica que a taxa de crescimento é muito superior à de outras indústrias, como a indústria transformadora, os serviços financeiros e os meios de comunicação e entretenimento.

Comparing Looker vs Power BI: unveiling the best BI tool

Aug 12, 2025 20 min de leitura

Let’s cut to the chase: Power BI is often the easiest pick if you’re already living in the Microsoft ecosystem. It’s fast, visual, and familiar. Looker, on the other hand, is built for something deeper, for teams that favor data modeling, Git-based workflows, and clean architecture at scale. I’ve worked extensively with both, and I can tell you, they’re not interchangeable. They were built with different priorities in mind.

So no, this isn’t another “which is better?” rundown, but rather: Which tool fits the way your business works and the way you want it to grow?

That’s what I’ll help you answer.

In this guide, I’ll walk you through the realistic tradeoffs from pricing and integration to CI/CD workflows and scaling pain points — all based on hands-on work with real clients. If you’re seriously weighing Looker vs Power BI, I’ll show you where each tool shines, where they fall short, and how to make the best call for your setup.

Looker vs Power BI: Which is the ideal business intelligence tool?

There’s no universal winner. Put simply, the best BI tool depends on what your business values most: speed, control, cost, or collaboration. Power BI works brilliantly for teams that require rapid dashboards and operate within the Microsoft ecosystem. Looker, on the other hand, delivers serious value when data pipelines are complex and consistency across departments is a must.
If you’re short on time (or presenting this to your exec team), here’s a quick table that sums up the key differences:

Strategic anglePower BILooker
Technology DNABuilt on the Microsoft ecosystem; best when used with Azure, Excel, etc.Cloud-native and Google-aligned; designed for modern data infrastructure
Primary audienceBusiness users, analysts, and hybrid technical teamsData engineers and dev teams comfortable with SQL + Git workflows
Integration mindsetTight integration within Microsoft stackData-agnostic; flexible across cloud platforms and databases
Adoption & training effortLow barrier to entry; intuitive for Excel-savvy teamsHigher learning curve favors teams with in-house data talent
Community & resourcesLarge user base, rich forums, plenty of how-tosSmaller but specialized; more direct support, less crowdsourced content

Stop wasting hours on manual reports — we’ll automate everything

An in-depth comparison of Looker vs Power BI

Before you choose a BI tool, you need to know how they actually behave under the hood. Let’s break down the core differences.

Power BI vs Looker: deployment strategies

Power BI supports both cloud and on-premises deployments, which is a major plus for organizations with legacy systems, strict compliance rules, or hybrid IT environments. The cloud-based Power BI Service is quick to launch and seamlessly integrates with Microsoft 365, while Power BI Report Server provides an on-prem option, though beware, it comes with more manual upkeep and slower updates.

Looker, on the other hand, is built for the cloud from the ground up. It doesn’t offer a traditional on-premises version like Power BI, but it does support customer-hosted deployments in cloud environments. The tradeoff? A leaner setup, automatic updates, and native scalability that grows with your business.

power BI vs. Looker deployment options
  • Choose Power BI if you’re in a regulated industry (like finance or government) or tied to on-prem infrastructure. Choose Looker if you want a fully cloud-native solution that’s fast to roll out and easy to scale.

Power BI vs Looker: data integration & compatibility

Power BI is a natural fit for businesses already invested in the Microsoft ecosystem. It connects effortlessly with Excel, Azure, Dynamics 365, e SharePoint, creating a smooth end-to-end experience. But it’s not locked into Microsoft; connectors are available for AWS, Google Cloud, Salesforce, SAP, and more. Just note that some integrations may need additional configuration or third-party tools to get the most out of them.

Looker is cloud-agnostic and built with modern data stacks in mind. It connects natively to leading cloud warehouses like BigQuery, Snowflake, and Redshift, as well as a wide range of SaaS platforms and custom APIs. Unlike Power BI, Looker doesn’t extract or store data; it runs live SQL queries directly on your data warehouse, which gives you real-time insights without duplicating or moving data.

  • Choose Power BI if your tech stack revolves around Microsoft tools and services. Choose Looker if you’re working across multiple clouds, warehouses, and SQL-based systems.

Power BI vs Looker: ETL & data storage

Power BI includes Power Query, a powerful, visual ETL tool. You can clean, reshape, and merge data using a UI that’s intuitive even for non-technical users. It’s a big reason why Power BI is so popular in business teams.

Looker doesn’t do ETL natively, it expects data to already be in your warehouse. Its job is to perform ‘query-time’ transformation and modeling on top of that data.. It pulls from live sources using SQL, caches the results, and lets you define transformations using LookML, its custom modeling language. It’s precise and reusable but comes with a steeper learning curve.

Note: While Power BI can query data live using DirectQuery, most of its signature features (like snappy dashboards and rich modeling) assume data is imported into memory. DirectQuery exists, but performance tradeoffs and feature limitations often push teams toward in-memory mode for anything beyond basic reporting.

  • Go with Power BI if you want a drag-and-drop ETL experience. It’s ideal for business users who need to clean, shape, and visualize data quickly without deep technical knowledge. Choose Looker if you’re building centralized, governed data models that support dozens of reports across teams. It gives you version control, reusability, and consistent logic across the board.

Power BI vs Looker: CI/CD process

Looker supports real CI/CD through Git. You can version control your models, branch, review, and deploy, just like software. For BI teams who treat dashboards like code, this is a game-changer.

Traditionally, Power BI relied on .pbix files edited by one developer at a time. No version control, no branching, and a lot of manual steps. But that’s changing.

With the new Power BI Projects (.pbip) format and Azure DevOps integration, Microsoft has introduced a modern CI/CD option. It enables version control, team collaboration, and automated deployments, but it requires extra configuration and DevOps familiarity.

Power BI vs Looker: CI/CD process
  • Choose Looker if you want a seamless Git-native experience and built-in version control. It’s simple, elegant, and designed for collaborative BI development from the start. Choose Power BI if your team is invested in Azure DevOps and you’re ready to build out a CI/CD pipeline. It’s no longer behind, just more hands-on.

Power BI vs Looker: data visualization

Power BI is the king of drag-and-drop dashboards. Its visuals are intuitive, customizable, and accessible even to non-analysts. With support for natural language queries and an open marketplace for custom visuals, it’s very user-friendly. Though you might run into bugs with third-party charts.

Looker gives you full control, but it expects more from you. Visuals are customizable, but often built with code. That gives you precision, which is great for devs and data engineers, but the learning curve is steeper.

Looker vs Power BI data visualisation name: power-bi-looker-reports
  • Power BI wins for speed and polish. Looker wins for control and reusability. Choose based on who’s building and maintaining your dashboards.

Power BI vs Looker: security & compliance

Both tools offer enterprise-grade security. Power BI relies on Azure AD, offers role-based access control through features like Row-Level and Object-Level Security, and supports DLP policies. It’s a natural fit for Microsoft-native security models.

Looker takes a slightly more granular approach. Its role-based access is more customizable, and it includes centralized governance, alerting, detailed auditing, and dynamic security rules defined directly in the LookML code. It’s especially strong in multi-team environments where data access needs to be fine-tuned across domains.

Power BI vs Looker: security & compliance comparison
  • Choose Power BI if your security model is built around Azure and Microsoft tools. It fits right in with enterprise policies and governance workflows. Choose Looker if you need granular data access across teams or regions. Its centralized control makes it easier to manage permissions at scale.

Power BI vs Looker: customization

Power BI gives you freedom on the frontend. You can drag, drop, resize, pin, and theme. It gives users creative control. Want to build an executive dashboard in 15 minutes? You probably can. There’s even a community gallery for custom visuals.

But that openness comes with tradeoffs: no enforced visual standards, meaning dashboards can get inconsistent fast unless you lock things down internally.

Looker takes the opposite approach. It’s more rigid by default, but deeply customizable through code. If you want pixel-perfect charts built exactly to spec and reusable components across teams, Looker gets you there. But you’ll need to write it, not click it.

  • Personally, I prefer Power BI for fast prototyping and ad hoc reporting. It’s like a whiteboard with buttons. But when clients needed dashboards to scale across 20 departments without visual chaos, Looker’s strict control became a blessing.

Your dashboards should speak the same language across teams — we’ll make it happen.

Power BI vs Looker: learning curve & usability

The learning curve depends entirely on who’s using the tool and what they’re trying to do.

For builders (analysts, developers, or data engineers), Power BI is easier to get started with. Its Excel-like interface and visual drag-and-drop design make connecting data and building dashboards a fast experience. You can go from raw data to reports in hours. That said, mastering DAX for more advanced logic takes time and often introduces a second learning curve.

Looker, on the other hand, demands more upfront. Builders need to learn LookML, version control via Git, and proper modeling principles. It’s not hard once you’re in the rhythm. But it’s not something most analysts can just “pick up.” It’s built for teams with a technical backbone.

For business users (the “explorers”), the story flips. Once Looker’s model is in place, it provides a safer, more guided experience. Metrics are pre-defined, logic is locked, and users can explore confidently without breaking anything. In Power BI, business users can still explore data, but if they go off the guided path, they might easily introduce inconsistencies without realizing it.

  • So, in short: Power BI lowers the barrier to entry.Looker raises it, but with better guardrails once you’re inside.

“How your team learns a BI tool matters, but what matters more is how your business maintains trust in the data over time. Power BI often spreads across departments, which can lead to inconsistent logic. Looker, by design, centralizes that responsibility, which pays off in long-term clarity.”

  • For self-service BI and rapid adoption? Power BI. For governed data and long-term consistency? Looker.

Power BI vs Looker: community & support

Power BI has one of the largest communities in the BI world. Between forums, YouTube tutorials, and MVPs, support is everywhere. But finding the right answer among the noise can take time.

Looker has a smaller but tighter community. It’s more dev-centric, often providing higher-quality discussions. Though you might hit roadblocks without dedicated vendor support.

  • If you want breadth, go with Power BI. If you value depth and specificity, Looker has the edge.

Power BI vs Looker: mobile experience

Power BI’s mobile app is a strong point. It’s responsive, secure, and supports layout customization for small screens. Just be prepared to spend time tailoring dashboards for mobile, as it doesn’t always adapt automatically.

Looker takes a lighter approach. It adapts dashboards using layout rules, but lacks a full-featured native app. It’s functional, but less engaging on mobile, especially for execs who expect polished, touch-first experiences.

Power BI vs. Looker mobile app comparison
  • Choose Power BI if mobile access is a priority for your stakeholders — it delivers a more refined, customizable app experience. Choose Looker if mobile isn’t mission-critical and you’re happy with a simplified, read-only view on the go.

Power BI vs Looker: pricing model & scalability

Power BI is easier to budget for, especially at the beginning. It offers a free version, and the entry-level Pro plan at $14/month per user is enough for most teams getting started. Premium plan ($24/month) offers more performance and sharing capabilities. It’s good if you’re scaling within Microsoft 365.

Looker’s pricing is custom and tends to be higher. It combines a base platform fee with license types (developers vs viewers) and usage-based costs based on query volume or API calls. Enterprise setups typically start around $3,000–$5,000 per month and scale with your needs. This model can be more cost-efficient if you have heavy, complex BI usage.

  • Choose Power BI if you want predictable, entry-level pricing and tight Microsoft 365 integration. Choose Looker if you need a scalable, usage-based model designed for high-demand, complex BI environments.

Don’t let siloed data block decisions. We’ll centralize it for you.

Conclusão: os pontos fortes distintivos do Power BI e do Looker

If you’ve made it this far, you might have reached the same conclusion as me: Power BI and Looker aren’t competing on the same playing field. They’re built for different teams, priorities, and infrastructures.

Power BI is ideal if you need fast results, broad adoption, and minimal setup. It’s a mature tool with a huge community and low learning curve, which is great for business users and teams already deep in the Microsoft stack. I’ve seen companies roll out dozens of dashboards in days, with very little IT involvement. That kind of velocity matters.

8 core Power BI benefits

Looker, on the other hand, is built for depth. It thrives in environments where data governance, model consistency, and multi-source complexity are critical. If you have a centralized data team or need strict control over how metrics are defined and reused, Looker gives you that architecture and the flexibility to grow without repainting every dashboard each time your schema changes.

7 core Looker benefits

So, which one should you choose? It depends on where you are and where you’re going. If you’re just getting started or building internal BI for sales and ops teams, Power BI is often the quickest win. But if you’re managing complex data flows, supporting multiple business units, or thinking long-term about governed, scalable analytics, Looker is worth the upfront effort.

And if you’re still unsure or already planning a BI transformation, we can help. At Innowise, we help businesses choose, implement, and evolve the right BI solutions based on their real-world challenges, not just software spec sheets.

FAQ

How do I decide between Google Looker vs Power BI for my business?

Start by assessing your current tech stack and how your teams use data. If you're already running on Microsoft (Excel, Azure, Teams), Power BI will feel like an extension of your existing setup. But if your data lives across multiple platforms, warehouses, or clouds, Looker gives you the flexibility to model and manage all of it in one place. It really comes down to how centralized your data governance is and who’s driving your BI efforts, whether that’s business users or a dedicated data team.

Yes, but there’s a catch. Looker is cloud-native, yet it can absolutely connect to on-prem databases like PostgreSQL, MySQL, or Oracle. The key is configuring secure access via JDBC drivers and managing that connection intelligently. If your setup is hybrid or transitioning to cloud, Looker handles that well. Just be ready for a bit more setup compared to a fully cloud-native stack.

It depends on your definition of “better.” Looker doesn't store data, it queries live from your warehouse, so its performance depends on how optimized your backend is. But when paired with tools like BigQuery or Snowflake, it handles large, complex datasets beautifully. Power BI loads data into memory, which can be lightning fast for curated datasets, but might buckle under pressure if you’re processing billions of rows. Bottom line? Looker scales better with raw volume, and Power BI is faster with refined datasets.

For massive, ever-growing datasets, Looker generally has the edge. It’s built to query directly from high-performance warehouses and doesn’t require duplicating data for analysis. Power BI can scale too, especially when backed by Azure, but you’ll likely need capacity planning, performance tuning, and sometimes architectural workarounds as you grow. If scalability is non-negotiable, and your data’s in the cloud, Looker wins on architecture alone.

Both tools offer solid integration options, but in different ways. Power BI connects well inside the Microsoft universe and supports services like Azure ML, Excel, and Power Automate. Looker, meanwhile, has an Action Hub and API-first approach, making it easier to plug into tools like Slack, Segment, or even custom apps. So the better question is: which ecosystem are you planning to build around?

Líderes de consultores ERP

Com mais de 18 anos de experiência em consultoria de TI e ERP, Kiryl Drabysheuski ajuda as organizações a desvendar sistemas complexos, modernizar fluxos de trabalho antigos e eliminar ineficiências manuais. Como consultor líder de ERP na Innowise, ele combina profundidade técnica com visão estratégica para fornecer soluções que aumentam a produtividade, garantem a conformidade e impulsionam o crescimento. Especialmente para clientes nos sectores da indústria transformadora, farmacêutica, petróleo e gás e serviços digitais.

Índice

    Contactar-nos

    Marcar uma chamada ou preencha o formulário abaixo e entraremos em contacto consigo assim que tivermos processado o seu pedido.

    Envie-nos uma mensagem de voz
    Anexar documentos
    Enviar ficheiro

    Pode anexar um ficheiro com um máximo de 2MB. Formatos de ficheiro válidos: pdf, jpg, jpeg, png.

    Ao clicar em Enviar, o utilizador autoriza a Innowise a processar os seus dados pessoais de acordo com a nossa Política de privacidade para lhe fornecer informações relevantes. Ao enviar o seu número de telefone, o utilizador aceita que o possamos contactar através de chamadas de voz, SMS e aplicações de mensagens. Poderão ser aplicadas tarifas de chamadas, mensagens e dados.

    Pode também enviar-nos o seu pedido
    para contact@innowise.com

    O que é que acontece a seguir?

    1

    Assim que recebermos e processarmos o seu pedido, entraremos em contacto consigo para necessidades do seu projeto e assinar um NDA para garantir a confidencialidade.

    2

    Depois de analisarmos os seus desejos, necessidades e expectativas, a nossa equipa elaborará uma proposta de projeto proposta de projeto com o âmbito do trabalho, dimensão da equipa, tempo e estimativas de custos.

    3

    Marcaremos uma reunião consigo para discutir a oferta e acertar os pormenores.

    4

    Por fim, assinaremos um contrato e começaremos a trabalhar no seu projeto imediatamente.

    seta