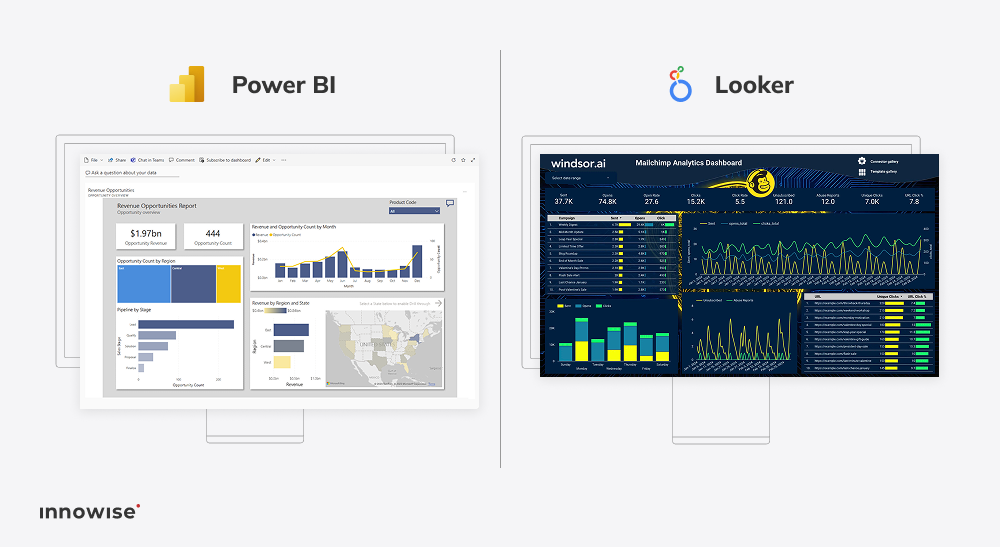
Please leave your contacts, we will send you our whitepaper by email
I consent to process my personal data in order to send personalized marketing materials in accordance with the Privacy Policy. By confirming the submission, you agree to receive marketing materials
Thank you!

The form has been successfully submitted.
Please find further information in your mailbox.

Innowise is an international full-cycle software development company founded in 2007. We are a team of 1600+ IT professionals developing software for other professionals worldwide.
About us
Innowise is an international full-cycle software development company founded in 2007. We are a team of 1600+ IT professionals developing software for other professionals worldwide.

Comparing Looker vs Power BI: unveiling the best BI tool

The global business intelligence (BI) market, valued at $27.11 billion in 2022, is on a robust growth trajectory, projected to reach $54.27 billion by 2030.The surging growth in the sector underscores the need for businesses to select the right BI platform from the plethora of tools available for diverse purposes. These range from operational needs and gaining clarity on inventory to enhancing customer experience and extracting value from IoT, according to Forbes:
Among the vast options, Looker and Power BI stand out as leading contenders on the market of BI solutions. According to Forbes, Microsoft Power BI is recognized as the top tool for data visualization in 2023, while Looker excels in data exploration.

Faced with these two powerhouses, one might ask, “Which of these tools is the right fit for my needs?” Answering this question, our Looker vs Power BI-guide dissects their technicalities, providing a comparative analysis along with expert insights and assisting businesses in making an informed choice.

Choosing between Looker and Power BI: finding the ideal business intelligence tool

Every BI tool in the market has been engineered with specific foundational goals. These foundations often dictate how each platform evolves. Let’s break down the conceptual underpinnings of these two.

Looker and Power BI are both Business Intelligence (BI) tools. They’re designed to extract insights from data and transform these insights into visual dashboards and reports. While Looker leans towards real-time data analytics and integrations, Power BI focuses on leveraging the Microsoft ecosystem to provide intuitive visualizations.

Looker, born in the age of cloud technologies, prides itself on flexibility and adaptability. It’s a platform that inherently understands the value of seamless integration, particularly given the proliferation of databases and third-party tools.

Microsoft Power BI, named a Leader in the 2023 Gartner® Magic Quadrant™ for Analytics and BI Platforms, benefits from a rich software ecosystem. While it emphasizes intuitive data visualization capabilities, its tight-knit integration with other Microsoft products often becomes its unique selling point.

Table of contents

“Looker, a relatively recent entrant in the BI realm, caters primarily to developers, offering a robust platform especially harmonious with Google’s infrastructure. Its capabilities in data transformation and custom visualization creation stand out. However, its smaller community can sometimes mean fewer readily-available resources. Conversely, Power BI boasts a vast community, making it a reservoir of knowledge and shared tools. This mature BI tool is versatile, catering to both end-users and developers. In essence, while Looker provides specialized tools for deep data work and aligns with Google’s ecosystem, Power BI’s broader appeal and resources can be a significant draw for many businesses.”

Philip Tihonovich

Head of Big Data at Innowise

Looker vs. Power BI: the showdown

In this comparison, we will evaluate Looker and Power BI across key business and technological aspects, ranging from pricing models to data security and data visualization. Additionally, we will incorporate insights from our Big Data specialist, grounding our analysis in the collective experience of various experts, user reviews, and hands-on work with both of these tools.

Pricing model & scalability

Power BI employs a tiered pricing model – every tier, from basic to premium, offers varying functionalities. Notably, Power BI offers a free version ideal for learning or individual projects, while Looker lacks a comparable complimentary offering.

Looker adopts a consumption-based approach. Instead of fixed rates, it calculates pricing based on data usage and number of users, ensuring businesses only pay for what they consume.

While Power BI’s tiered pricing model provides clear distinctions, making it easier for businesses to understand what they’re getting, its ‘Premium Per User’ offers flexibility to smaller teams needing advanced features without breaking the bank. Looker, conversely, is intriguing for businesses that cannot predict monthly BI engagement and prefer a model that scales with use. 

Typically, Looker charges around $5,000 monthly for a group of standard 10 users. However, they offer customized pricing based on user needs. In contrast, Power BI provides a more budget-friendly alternative. Power BI Pro is priced at $10/month per user for self-service data visualization, while Power BI Premium comes in at $20/month per user or an overarching $4,955/month without user restrictions. However, your choice may depend on scaling models.

Power BI’s integration with Azure offers a scaling model that has predefined tiers. These tiers are designed for varied data loads, but transitioning between them may not be instantaneous. There might be scenarios where sudden spikes in data processing needs can result in performance bottlenecks if the tier isn’t adjusted in time. Looker, backed by Google Cloud, uses a more dynamic scaling approach. Due to its underlying cloud infrastructure, it can quickly provision additional resources in response to increased demand. This can be especially advantageous when the data load is unpredictable.

Rate this article:

4/5

4.8/5 (45 reviews)

“For startups or small businesses with predictable BI needs, Power BI Pro or PPU might be more economical. However, larger enterprises or those with volatile usage patterns might find Looker’s consumption-based pricing beneficial in the long run.”

Philip Tihonovich

Head of Big Data at Innowise

Deployment strategies

Looker is a 100% cloud-based platform, bringing forth the advantages of instant scalability and zero infrastructure. With Looker, there’s no need for companies to stress about physical servers or technical teams dedicated exclusively to its upkeep. From SMBs to large enterprises, the scalable nature of Looker’s infrastructure allows for unhindered growth. Additionally, the automatic updates that Looker rolls out mean that businesses always have the most up-to-date features without any downtime or significant manual intervention.

While Power BI does offer a cloud-based solution known as Power BI Service, it also comes with an on-premises version called Power BI Report Server. This gives organizations the flexibility to choose their deployment option based on their infrastructure, security, and scalability needs.

The Power BI Service is quick, automatically updated, and integrates well with other Microsoft products, giving it an edge for those already embedded in the Microsoft ecosystem. However, the on-premises version requires more maintenance and can be subjected to downtime during updates.

In terms of scalability, Power BI’s cloud version, just like Looker, is designed to scale seamlessly. But the on-premises deployment might face limitations depending on the organization’s IT resources. Additionally, while Looker primarily focuses on the cloud, Power BI offers both solutions, which might be an advantage for organizations that require more flexibility in their deployment strategy.

“While Looker demonstrates undeniable strengths in its cloud-first approach, Power BI’s flexibility in deployment options gives it a competitive edge. Power BI’s dual deployment strategies can cater to a broader range of organizational needs, from those who prefer the cloud to those who still rely on on-premises systems.”

Philip Tihonovich

Head of Big Data at Innowise

Data integration & compatibility

Power BI, being a Microsoft offspring, is naturally optimized for Microsoft technologies such as Azure, Excel, and SharePoint. This makes it an ideal choice for enterprises deeply ingrained in the Microsoft infrastructure. However, its versatility doesn’t end there; Power BI also offers connectivity to a range of other services, including AWS, Google Cloud Platform, IBM, SAP, and more, catering to diverse data environments.

Looker, part of the Google Cloud portfolio, offers an expansive range of connectors. From databases to SaaS platforms, Looker’s flexibility is designed to be data-agnostic, ensuring that diverse data sources, even the less common ones, can be integrated.

“Choosing between Power BI and Looker requires a thorough understanding of your organization’s current data architecture and future scalability plans. Here’s a three-step guide:


  • Assess your ecosystem: If you’re predominantly using Microsoft tools and plan to continue doing so, Power BI will provide a more streamlined experience. If your organization uses a myriad of platforms or anticipates diversifying its tech stack, Looker offers broader compatibility.
  • Forecast scalability: While both tools can scale, Looker’s extensive connector range might be advantageous if you’re considering incorporating more varied data sources in the future.
  • Evaluate hidden costs: Integrations might sometimes require additional connectors or third-party tools, potentially incurring extra expenses. Always check the full integration requirements.”


Philip Tihonovich

Head of Big Data at Innowise

ETL & data storage

Looker operates as an SQL query generator, pulling data directly from its associated databases. However, Looker does not offer inherent storage capabilities for the fetched data. In terms of ETL, Looker doesn’t have a dedicated mechanism but compensates slightly with its data modeling. This allows for more refined results like displaying transactions by specific time frames. Yet, this approach means the entire data table gets processed first.

Furthermore, Looker does employ a caching mechanism, storing retrieved data temporarily to speed up subsequent similar requests. The data stays in cache for a set period, such as an hour or a day, enhancing its retrieval speed. But, given Looker’s lack of comprehensive ETL processes and internal data storage, it seems at a slight disadvantage.

When evaluating BI tools, the ability to manipulate and customize data is crucial. Power Query is a feature within Power BI that facilitates data transformation, enabling users to extract and present data in the desired format. Looker, on the other hand, differentiates itself with its modeling layer, LookML. This language allows for deep customization and ensures uniformity, making it apt for businesses looking for a tailored experience without compromise.

“While Looker emphasizes data manipulation through code, Power Query offers a more visual data transformation experience. The choice hinges on available resources and preferences: some teams lean towards a visual interface, while others are more inclined to work directly with code.”

Philip Tihonovich

Head of Big Data at Innowise

CI/CD process

Looker boasts innate integration with Git, auto-recording changes to its code in separate branches within the VCS. Post code reviews, these branches are merged and deployed. Thanks to Git’s merge conflict detection, team leads can streamline and unify code versions. Additionally, Looker supports versioning, a feature absent in Power BI. This version control further enhances Looker’s collaborative capabilities, setting it a notch higher in this competition.

On the contrary, Power BI’s workflow is distinct. Developers typically craft reports in Power BI Desktop, then publish to the Power BI Service. While most changes necessitate using the Desktop, some adjustments can be made directly in the Service, albeit with limitations. A significant limitation is that Power BI does not permit multiple individuals to work on the same report simultaneously. Collaborative efforts in Power BI can thus be a challenge. When multiple users edit a report, the risk of overwriting changes arises. Resolving conflicts often entails diving deep into the report’s XML structure to pinpoint differences.

“Having worked with both Looker and Power BI, I can attest to Looker’s collaborative features, thanks to its Git integration. It simplifies versioning and deployment. Power BI, while strong in data visualization, can sometimes pose challenges for team collaboration, especially with the Desktop and Service divide. For those deeply integrated into the Microsoft world, Power BI still has its merits. However, regarding teamwork and CI/CD efficiency, Looker stands out.”

Philip Tihonovich

Head of Big Data at Innowise

Data visualization

Power BI excels with its user-centric interface designed for a broad spectrum of users, boasting intuitive drag-and-drop mechanics and an extensive library of templates. One of its standout features is the Q&A tool that swiftly transforms user queries into visual insights, making it invaluable for those needing immediate insights without a deep data background. Moreover, Power BI offers the possibility for users to employ custom visualizations created by the community or purchase more specialized ones. This open approach means that while there is a vast array of choices, there might be potential for inconsistencies or bugs from third-party visualizations.

Looker, in contrast, targets those with a deeper understanding of data. It provides granular control over visualization elements, ideal for experts who desire detailed adjustments. A distinguishing factor for Looker is its support for developing and publishing custom visualizations. Professionals can even craft restricted visualizations tailored for personal use, ensuring specificity without compromising the broader dashboard experience.

“When visualizing with Looker, there’s a necessity to adhere to certain layout standards, whereas Power BI offers unparalleled freedom in this domain. With Power BI, every element can be placed precisely where desired, granting more customization possibilities. Yet, this extensive personalization often comes with a price tag. Another thing to note: while harnessing community-made content in Power BI is feasible, it’s paramount to approach it with caution due to potential inconsistencies or bugs. On the whole, each tool caters to distinct needs and preferences, but both are formidable in their respective arenas.”

Philip Tihonovich

Head of Big Data at Innowise

Security & compliance

Power BI and Looker prioritize data security through encryption in transit and at rest, robust authentication, role-based access control, data governance, auditing, and compliance certifications.

Power BI secures data in transit with SSL/TLS and at rest with AES-256 encryption. Its Azure Active Directory integration enhances security, and it offers data loss prevention (DLP) policies for compliance.

Looker uses standard encryption for data in transit and at rest. It shines with highly customizable role-based access control, centralized data governance, and advanced monitoring and alerts for proactive security.

“Power BI may be a leader in data security for organizations deeply integrated into the Microsoft ecosystem, offering Azure Active Directory integration and robust role-based access control (RBAC). It’s well-suited for enterprises with complex security needs and data loss prevention (DLP) requirements. Looker, however, shines when customization and flexibility are paramount. Its fine-grained RBAC and cross-platform compatibility make it an excellent choice for organizations with diverse data environments. Looker’s focus on centralized data governance and advanced monitoring and alerting can be advantageous for maintaining data security and addressing threats effectively.”

Philip Tihonovich

Head of Big Data at Innowise

Learning curve & usability

The ease of adoption can dictate the success of a BI tool. Power BI, with its intuitive interface, offers a gentle learning curve, especially for those familiar with other Microsoft products. Looker, while powerful, demands a steeper learning curve, especially when delving into LookML. 

“For those familiar with Excel or SharePoint, diving into Power BI is relatively easy. The abundance of resources, tutorials, and forum discussions makes it easier to kickstart your journey — simply download the desktop version and get going. On the other hand, Looker, despite offering depth and granularity, has a slightly steeper entry point. Before diving in, one has to request a demo and navigate a bureaucratic layer, waiting for their team to make contact. This waiting period can be a deterrent for those eager to start immediately.”

Philip Tihonovich

Head of Big Data at Innowise

Community & support

Power BI, as a Microsoft offering, boasts a vast support system complemented by a broad and active community. This expansive network ensures that users have access to a wealth of tutorials, forums, and official documentation. Additionally, Microsoft’s dedicated support channels for Power BI can be responsive and comprehensive. However, with such a sizable community, finding specific answers can sometimes be akin to searching for a needle in a haystack due to the sheer volume of information.

Looker, while having a smaller footprint in terms of community size, provides a tightly-knit group of enthusiasts that often delve into detailed discussions. While there might be fewer off-the-shelf solutions available, the support from Looker can be more personalized, given its scale. This intimacy means users can sometimes get direct, focused advice or solutions more rapidly.

“Power BI’s vast ecosystem, backed by Microsoft’s support infrastructure, ensures there’s always some form of assistance available. Yet, the challenge is discerning the most relevant from the plethora. Looker, with its more concentrated community, provides a depth of engagement, often accompanied by rapid and tailored support responses. Organizations should reflect on their needs: for those requiring extensive resources and a wide array of solutions, Power BI stands out. However, if your organization values in-depth, focused discussions and a more personalized support experience, Looker might be a good fit.”

Philip Tihonovich

Head of Big Data at Innowise

Mobile experience

In an era of mobility, BI tools must adapt. Power BI offers a stellar mobile application, ensuring decision-makers are informed on the go. The interface is intuitive, and reports adapt seamlessly to smaller screens. However, creating a mobile layout in Power BI requires additional steps. Looker, on the other hand, eases this process. Although its mobile app is not properly optimized, Looker easily converts the desktop layout to mobile through its development rules.

“Having worked extensively with both platforms, I’ve felt the contrast. Power BI’s mobile app is undoubtedly a game-changer, but crafting that perfect mobile layout can sometimes be an extra layer of work. Looker, while simplifying the desktop-to-mobile transition with its development guidelines, falls short in its mobile application experience. It’s not as well-optimized as one might hope, often leaving users wanting more.”

Philip Tihonovich

Head of Big Data at Innowise

Wrapping up: the distinctive strengths of Power BI and Looker

Both Power BI and Looker have carved out unique spaces in the BI landscape. Power BI, deeply integrated with the Microsoft ecosystem, offers user-friendliness and a vast support network. Looker, backed by Google Cloud, provides extensive customization and a flexible pricing model that scales with usage. In essence, for those embedded within Microsoft tools and seeking intuitive functionalities, Power BI might be the better pick. Meanwhile, businesses valuing intricate customization, dynamic scalability, and a more personalized community might gravitate towards Looker.

FAQ

Deciding between Looker and Power BI hinges on several factors: your current technology stack, the nature of your data sources, the scalability you require, and your team’s familiarity with the platforms. Always consider your organization’s unique needs, goals, and technological landscape. If you’re already invested in Microsoft services, Power BI might offer smoother integration. Conversely, Looker provides broader database compatibility and could be the go-to for diversified data sources.

Yes, Looker can connect to both cloud-based and on-premises databases. It’s designed with flexibility in mind to cater to businesses with hybrid data environments. As always, ensure you have the necessary drivers and configurations set up for seamless connectivity.

Absolutely. Power BI offers a free desktop version, making it attractive for small businesses or startups on a tight budget. It provides robust data visualization capabilities, and as your business grows, you can scale up to more advanced, paid versions of the platform.

Both Looker and Power BI are designed to handle vast amounts of data, but their performance can vary based on specific scenarios. Looker, being browser-based and leveraging powerful databases behind the scenes, can handle massive datasets with finesse. Power BI, on the other hand, tightly integrates with Azure, Microsoft’s cloud service, which offers scalability options. The key is understanding your data load and growth projections to ensure whichever tool you choose can scale in sync with your needs.

Yes, both Looker and Power BI offer a range of integrations with popular analytics tools. Looker has its Action Hub, which allows integration with various third-party platforms, while Power BI can connect with a multitude of services, especially within the Microsoft ecosystem. Always ensure your specific tool or service is supported, and consider potential future integrations when choosing.

Related content

Contact us

    Please include project details, duration, tech stack, IT professionals needed, and other relevant info
    Record a voice message about your
    project to help us understand it better
    Attach additional documents as needed
    Upload file

    You can attach up to 1 file of 2MB overall. Valid files: pdf, jpg, jpeg, png

    Please be informed that when you click the Send button Innowise will process your personal data in accordance with our Privacy Policy for the purpose of providing you with appropriate information.

    What happens next?

    1

    Having received and processed your request, we will get back to you shortly to detail your project needs and sign an NDA to ensure the confidentiality of information.

    2

    After examining requirements, our analysts and developers devise a project proposal with the scope of works, team size, time, and cost estimates.

    3

    We arrange a meeting with you to discuss the offer and come to an agreement.

    4

    We sign a contract and start working on your project as quickly as possible.

    Thank you!

    Your message has been sent.
    We’ll process your request and contact you back as soon as possible.

    Thank you!

    Your message has been sent.
    We’ll process your request and contact you back as soon as possible.

    arrow