|
Tipo di integrazione |
Soluzioni (esempi) |
Vantaggi |
|
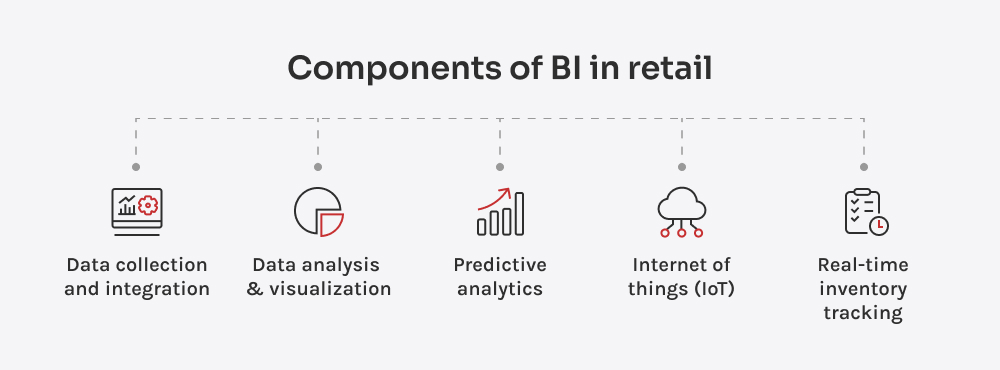
Piattaforme di e-commerce | Shopify, Magento | Visione unificata di prodotti, pubblico, campagne; migliore strategia omnichannel; driver di fatturato più chiari |
|
Software per l'assistenza clienti | Zendesk, Freshdesk | Collega il feedback alle tendenze aziendali; identifica i punti dolenti del servizio; migliora le previsioni e la pianificazione. |
|
Software di gestione dell'inventario |
NetSuite, Brightpearl, IMS personalizzato | Tracciamento delle scorte in tempo reale; evita l'eccesso di scorte e l'esaurimento delle scorte; migliora il rifornimento e il flusso di cassa. |
|
Software CRM | Salesforce, HubSpot | Approfondimento della conoscenza dei clienti; migliore segmentazione; acquisti ripetuti grazie alla personalizzazione |
| Sistemi per punti vendita (PoS) | Quadrato, Lightspeed, Trifoglio | Rileva i modelli dei negozi locali; incrementa il traffico pedonale e le vendite con un'allocazione più intelligente delle scorte. |
| Gestione delle campagne di marketing | Mailchimp, Klaviyo, strumenti personalizzati | Collega le campagne alle vendite e alla fidelizzazione effettive; rivela il vero ROI, non solo i click |
|
Software di gestione dei fornitori | SAP Ariba, Coupa, portali dei fornitori | Monitorare le prestazioni dei fornitori; ridurre i rischi; migliorare la resilienza della catena di fornitura. |
| Sensori e scaffali intelligenti IoT | Sistemi RFID, sensori di peso, computer vision | Traccia la disponibilità a scaffale; recupera tempestivamente le vendite perse; ottimizza lo spazio a scaffale e la rotazione delle scorte. |

 Assumi