Your message has been sent.
We’ll process your request and contact you back as soon as possible.
The form has been successfully submitted.
Please find further information in your mailbox.
Downtime is one of the most devastating issues that may occur with your business. It leads to direct and indirect costs and may even result in reputational risks. Therefore, being aware of downtime is very important and this is where various monitoring solutions come into play. With such tools that include metrics and logs, developers have an opportunity to minimize software downtime.
Observability and monitoring go hand in hand during the development and support period. While they are not synonyms, they have a lot of common points under the hood. By choosing the right strategy for observability and monitoring applications, developers can reduce the risks of direct and indirect costs. If you are looking for useful information about observability and monitoring in DevOps you are in the right place.


Don’t let downtimes crush your business.
We utilize advanced DevOps practices to maintain smooth operations and minimize issues.
Let’s start with the figures as they are the best way to show how downtime can negatively impact your business. According to recent studies by Gartner, the average downtime cost is about $5,500 per 60 seconds. However, this figure may vary according to the business operation features. When it comes to hourly downtime costs, they look even more impressive. The range starts at $140,000 and ends up at $540,000, which is a massive amount, which can be compared with the average price of a house in Miami.
For 98% of businesses, a single hour of downtime costs $100,000 and more, while for almost 81% of companies the 60 minutes outage is even more expensive (over $300,000). Some 33% of enterprises estimate a loss of up to $5 million for the same one-hour downtime.
In addition to direct costs, it is also important to consider indirect losses associated with time wastage. Such outages will require precious minutes and sometimes hours for the problem to be solved. According to the latest research, such interruptions may take 238 minutes a day, which, in turn, may result in 6.2 hours per day and 31 hours per week consequently.
While you can’t avoid such downtime situations or receive immunity from them by any means, you can add some useful practices like monitoring and observability that will allow you to react to such situations.
Monitoring in DevOps includes a set of tools and techniques that allow us to understand the current state of systems with the help of metrics and logs. Simply put, monitoring tools in DevOps can notify the team about possible problems and show the current state of the system.
There are four main DevOps measurements that a team should employ to ensure reasonable monitoring:
There are plenty of application monitoring DevOps tools nowadays, but not all of them are good enough to satisfy all needs. When searching for the right feature for monitoring, there are several keys to consider:
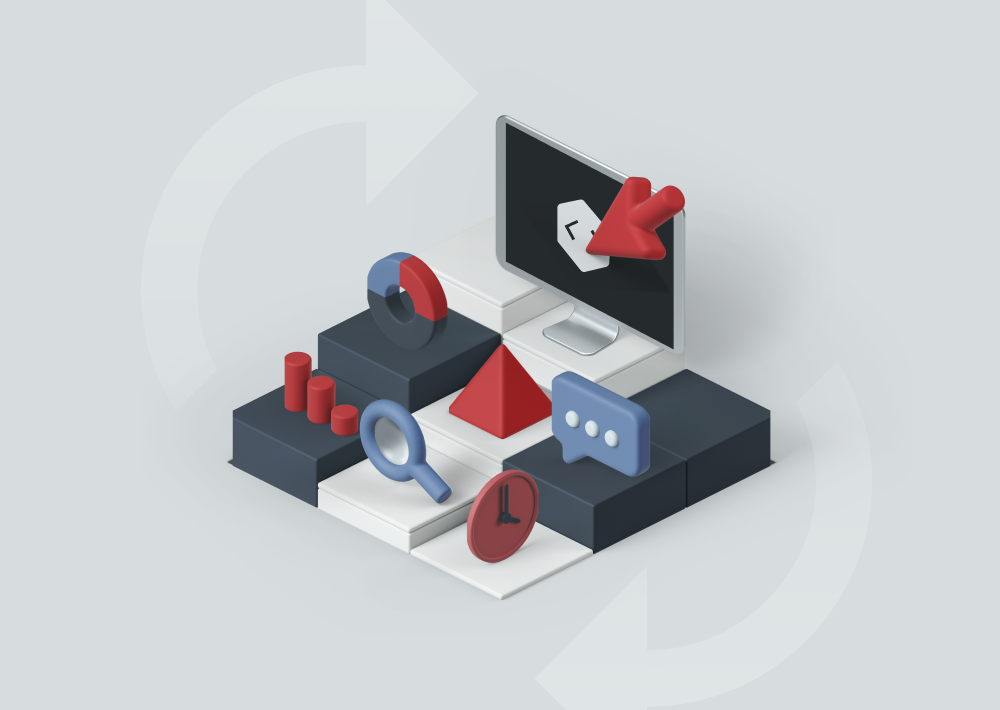
Observability is a set of tools and techniques that allows the developers to see how systems behave by analyzing patterns and properties which are not known in advance.
With the help of observability DevOps tools, teams have an opportunity to assess the health of the internal system and detect unknown issues such as performance bottlenecks. Moreover, by using this set of tools and techniques, developers can receive essential feedback in DevOps.
Observability’s primary components include:
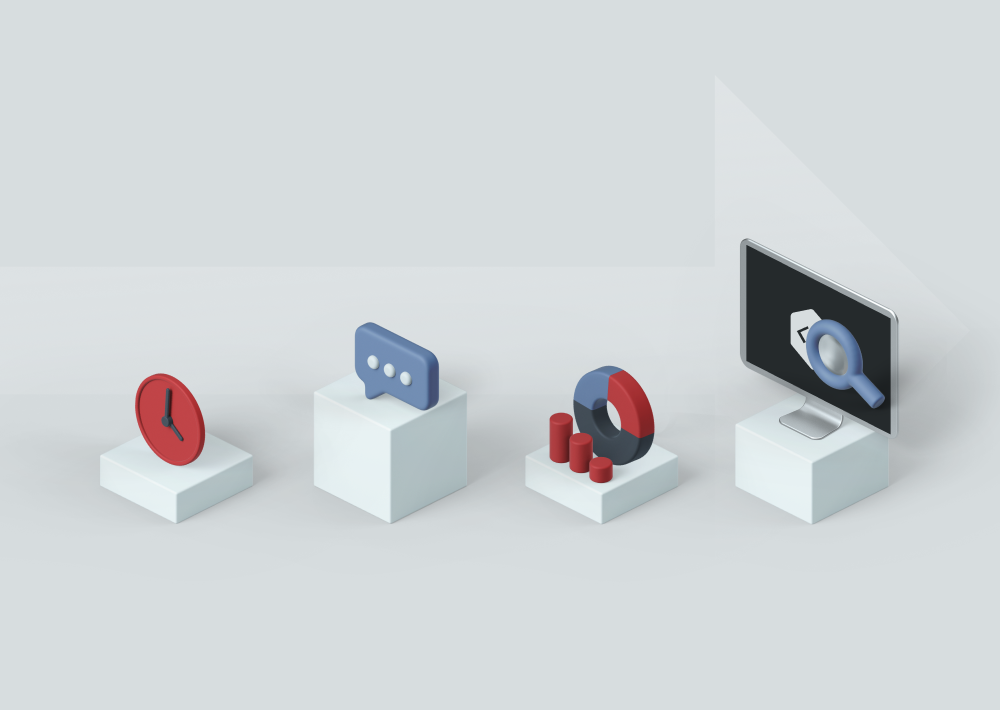
When comparing observability and monitoring it is not simply about which approach is better. It is about what purposes a team has when it applies both of them. While monitoring tools allow developers to reveal issues, observability serves to find the source of problems so that to avoid such errors in the future or to minimize debug time.
The difference between both is that monitoring can notify the team about current problems and show the current state of a system, whereas observability allows the developers to debug the system and get the necessary data to understand the root cause of issues. Simply put, monitoring answers the question “What has happened” while observability gives a reply to the “Why it has happened” query.
Both monitoring and observability in DevOps should go hand in hand when it comes to what should be implemented. Together they provide indicators of an outage, detect outages, help debug and provide long-term trends for business and for capacity planning.
With all the above in mind, it should be mentioned that monitoring is an integral part of observability. It is very important in DevOps to know what has happened with the app or website and this is where monitoring comes into play. Moreover, it is possible to monitor without observing. However, to reduce the risks of similar issues in the future, developers should use observability tools.
Monitoring and observability are both very important in DevOps as they help developers reveal errors and downtimes, tackle all possible issues and even eliminate the root of such problems. Innowise uses this combination in its everyday activities in order to provide customers with premium-quality robust products. Minimizing downtime cases is what we put at the forefront of our development and maintenance processes.
Observability and monitoring play a crucial role in DevOps practices by providing insights into the performance, reliability, and overall health of systems and applications. For example, through continuous monitoring, our DevOps team identifies issues, analyzes trends, and proactively addresses potential problems, ensuring the delivery of high-quality software. Observability goes beyond traditional monitoring, emphasizing the ability to understand and analyze system behavior, making it an integral part of maintaining and improving DevOps workflows.
These practices collectively enhance the overall efficiency, reliability, and responsiveness of DevOps workflows, facilitating swift and informed decision-making. Through continuous monitoring, DevOps teams can promptly detect and address issues, ensuring optimal application and infrastructure health. Observability takes it a step further, offering a deeper understanding of system interactions and dependencies.
Commonly used tools and techniques for observability and monitoring in DevOps include popular solutions like Prometheus, Grafana, ELK Stack (Elasticsearch, Logstash, Kibana), and application performance management tools such as New Relic and Dynatrace.






Your message has been sent.
We’ll process your request and contact you back as soon as possible.

By signing up you agree to our Privacy Policy, including the use of cookies and transfer of your personal information.