O formulário foi enviado com sucesso.
Encontrará mais informações na sua caixa de correio.
Selecionar a língua
"Pensar em retail business intelligence as your silent strategist that helps you understand what’s really going on in your store: what’s selling fast, when foot traffic peaks, which team members are shining, and where profits might be leaking. Every day, I see how BI does pull data from your systems and turns it into clear charts, reports, and takeaways you can use to make smarter moves."
Delivery Manager in E-commerce
In plain terms, business intelligence (BI) is a set of tools, systems, and practices that help companies understand what’s really going on inside their business — from sales performance to customer behavior, inventory levels to marketing success, and everything in between.
Why is it worth it to use retail business intelligence? Want to understand which channel drives the highest-value shoppers? BI can show that. Trying to spot in-store behaviors that correlate with online purchases? BI can reveal those patterns. Need to know which campaigns resonate with mobile-first buyers versus in-store browsers? BI pulls that apart with clarity.
Business intelligence in retail industry lets you move beyond assumptions. It equips them with the confidence to launch smarter marketing campaigns, deliver personalized experiences, and fine-tune strategies in real-time.
BI isn’t just a single static dashboard. It’s more like a collection of information that reflects everything about your business. It gathers data about sales, levels of stock, and customers’ activities so that you can fully comprehend everything, analyze it, and accurately make decisions when it matters the most. Here are the key components of BI in retail industry that can help your business operate smarter and more effectively.
Retailers are swimming in data! You collect data from numerous sources, such as sales transactions, customer data, inventory data, etc. Even third-party data like supplier info or weather feeds can play a role. How can you sort through all that? Manually? No way.
The AWS Glue, Azure Data Factory, and GCP Dataproc tools gather data from across your retail ecosystem: POS systems, online stores, inventory tools, and customer apps. This data is centralized in cloud storage like AWS S3 or Azure Blob, cleaned up, and transformed to be ready for analytics From there, it’s delivered to data warehouses such as Snowflake, BigQuery, or Redshift, where BI tools can turn it into accurate, actionable information to optimize inventory, boost sales, and make reasonable business decisions.
Raw numbers sitting in a spreadsheet won’t do much for anyone. But when you plug that data into a BI tool — that’s when it starts to tell you a story. Most retailers use tools like Tableau, Power BI, or Looker to get a clear view of their data and KPIs7.
Here’s how it typically works:
Need to drill down from total revenue to revenue by product category, by store, or even by day? Just click. Want to filter by region, campaign, or customer segment? You got it. This is the best part, I think.
Predictive analytics combines a wealth of historical information, statistical models, and machine learning to answer one big question: What’s likely to happen next?
It starts by feeding the system a rich mix of data, such as past sales patterns, seasonality trends, customer behavior, and external factors like weather, holidays, or even local events. Then, the BI platform runs that data through algorithms — often built into tools like SAS, IBM SPSS, or Azure Machine Learning. These models spot patterns humans would miss and generate forecasts that help you plan ahead.
As for retailers, many platforms come with pre-built forecasting templates tailored specifically for this industry. You just set your variables, pick a timeframe, and let the system do the rest.
IoT is like the eyes and ears of your retail space. These devices constantly gather data from the physical world and stream it straight into your BI system.
Let’s see how it all comes together:
All of this real-time data adds a live, physical-world layer to your digital insights. That means rather than simply knowing what sold, you begin to figure out the nuances of why it sold. Was it product placement? Shelf visibility? A sudden spike in-store traffic? The data is sending signals, and all you need to do is pay attention.
Two classic stock-related nightmares in retail are overstocking and stockouts. Overstocking ties up cash, eats up space, and often leads to markdowns or waste, as the shelves (and backrooms) are packed, but the products aren’t moving. When bestsellers vanish just when demand peaks, it causes stockouts with lost sales and frustrated customers.
The BI system tracks every sale, return, restock, or transfer and lets you analyze stock levels alongside sales trends, seasonal patterns, and customer behavior to manage inventory smartly.
It works like this:
From my experience, I’ve seen how business intelligence drastically changes the way retailers operate, from day-to-day decisions to long-term strategy. Below, I’d like to share a more down-to-earth perspective on how it can really impact your business.
In my years of working in retail, I’ve witnessed the chaos that comes from not having clear insight into inventory. Stockouts? They’re a nightmare. Overstock? Also a huge problem, especially with perishable goods or seasonal items. Business intelligence in retail solves this by allowing you to have an up-to-the-minute look at your inventory levels with no manual checks. It predicts demand based on historical data so that you can plan ahead.
I’ve noticed that BI brings a deeper understanding of customers than what traditional methods can offer. Retailers often have data such as sales history, demographics, etc., but BI consolidates that info and gives clear patterns. It’s not just about who’s buying; it’s about understanding why and how they shop. This knowledge allows for targeted approaches that speak to customer needs on a much more personal level and bring them back for more.
Understanding which promotions worked, which products had the best margins, or which customer segments responded well to specific campaigns is where BI actually helps. With this information, you can smartly adjust prices, pinpoint bestsellers to maintain their availability, and run promotions catering to customer interests.
I worked with a mid-sized fashion retailer that ran a seasonal discount campaign across multiple product lines, thinking it would drive volume. It didn’t. Some stores barely moved stock, and margins took a hit.
Once BI tools were in place, they got a clearer picture: outerwear was selling better in suburban locations during early autumn, while urban stores were shifting smaller-ticket items like scarves and bags. They adjusted the next promo accordingly — targeted SKUs, smarter timing, and more focused markdowns. It wasn’t magic, just better decisions based on real numbers. And it saved them from repeating the same expensive mistake.
BI lets you see where inventory is piling up or where deliveries are slowing you down so you can fix issues on the go. Thus, you plan staff schedules based on real foot traffic, so you’re not over- or understaffed. It also makes it easier to focus your time, people, and budget on the areas that 100% bring results.
Integrations are far from being just extra expenses. They help you make better decisions, save time, and boost profits. And to make that happen, these key integrations will give you an accurate, 360-degree view of your business.
Selling online without integrating your e-commerce platform is like flying blind. Orders, customer data, and channel-specific trends stay scattered. However, everything works differently when you tie platforms like Shopify or Magento into your BI.
How? You’ll finally see which products, audiences, and campaigns actually move the needle. You’ll see abandoned cart rates, bestselling SKUs, conversion rates, and much more meaningful figures — all in one place.
From my experience, retailers who integrate e-commerce early build a much sharper omnichannel strategy. Those who don’t usually end up overwhelmed trying to stitch reports together manually.
Customers tell you exactly what they need. The main thing is to know where to listen. Most brands let their service data (Zendesk, Freshdesk) work in a vacuum.
A mid-sized fashion brand, which I consulted to once, discovered delayed shipping complaints spiked right after seasonal promos. When the team merged their Zendesk customer service data with the BI platform, they tracked complaint patterns against promo periods. The analysis uncovered that the spike in orders during seasonal promos surpassed pre-promo forecasting. In other words, demand was not being accurately predicted, and often, there were far too few resources to address the inflow. Poor forecasting was the thing.
I think service data is where future revenue hides. Service teams already collect valuable feedback. You just need to plug it into your bigger strategy.
You can either drown in excess stock or lose sales to empty shelves. Neither is good. Integrated platforms like NetSuite, Brightpearl, or custom IMS tools, send real-time stock status, shrinkage rates, and turnover speeds into your BI dashboard.
This lets you:
I’ve seen firsthand how businesses that nail this balance grow faster because they free up cash and meet customer demand more consistently.
Customer data often lives in CRMs but stays disconnected from retail BI analytics. You’ll make a great decision when you link CRMs like Salesforce or HubSpot to BI systems. It enables deeper analysis of buying behavior, customer lifetime value, and segmentation. The result you’ll have is better-targeted campaigns, strengthened relationships, and repeat shopping with data-driven personalization.
From what I’ve seen, the fastest-growing retailers treat their PoS systems not as cash registers but as constant feedback loops into customer behavior.
One home goods chain assumed all stores performed equally. After integrating PoS data into their BI system, they uncovered that stores in suburban areas needed totally different inventory mixes than urban locations. Localized stock boosted foot traffic and basket size almost overnight. Such great results are more than real when you connect PoS systems to BI platforms.
Marketing campaigns often get measured in isolation, making it difficult to understand true ROI or how marketing efforts impact overall business goals. Don’t make this mistake. Invest smart.
Plataformas como Mailchimp, Klaviyo, or custom tools in your BI ecosystem reveal the full customer journey and connect campaign performance to actual revenue, retention rates, and lifetime value — not just clicks or opens.
In my opinion, supply data deserves the same attention as customer data, especially after what we’ve seen during pandemic-driven supply chain collapses. Platforms like SAP Ariba, Coupa, or even simple custom vendor portals, when integrated into BI, show supplier lead times, defect rates, and contract compliance in real-time.
Traditional inventory tracking is reactive. You only know a product is out of stock when it’s already hurting sales. IoT smart shelves flip that around. They detect real-time stock levels on the shelf itself, not just in the warehouse system.
Smart shelves are equipped with sensors. When we talk about “sensors” on smart shelves, we usually mean three main types:
Small load cells or pressure mats built into the shelf detect how much weight is sitting on it. When someone picks up a product, the weight drops slightly — and the system logs it.
Shelves fitted with RFID antennas can detect when tagged items are added, moved, or removed. Every product with an RFID tag sends a tiny wireless signal, so the shelf knows exactly which items are present.
Small cameras monitor shelf space visually, and AI models identify products, gaps, and customer interactions. You can literally track how often customers touch a product but leave without buying.
Data flows from these sensors into your BI system through APIs or IoT integration hubs. Your BI dashboards can then show you the following:
For example, if a high-margin product consistently runs out in one store but sits fully in another, your system catches it before you lose sales or overstock.
Business intelligence is excellent for seeing what’s happened in the past, but business analytics (BA) takes that to the next level by telling you why things happened and predicting what’s coming. BA doesn’t just show trends — it breaks down the numbers, spots hidden patterns, and forecasts future shifts.
So you could say:
In many retail systems and platforms today, BA is actually built right into BI solutions as the more advanced layer (think predictive analytics, trend spotting, and recommendations). They’re closely linked, and in retail, they usually work together as part of a smart data strategy.
Tipo de integração | Solutions (Examples) | Benefícios |
Plataformas de comércio eletrónico | Shopify, Magento | Unified view of products, audiences, campaigns; better omnichannel strategy; clearer revenue drivers |
Customer service software | Zendesk, Freshdesk | Links feedback to business trends; identifies service pain points; improves forecasting and planning |
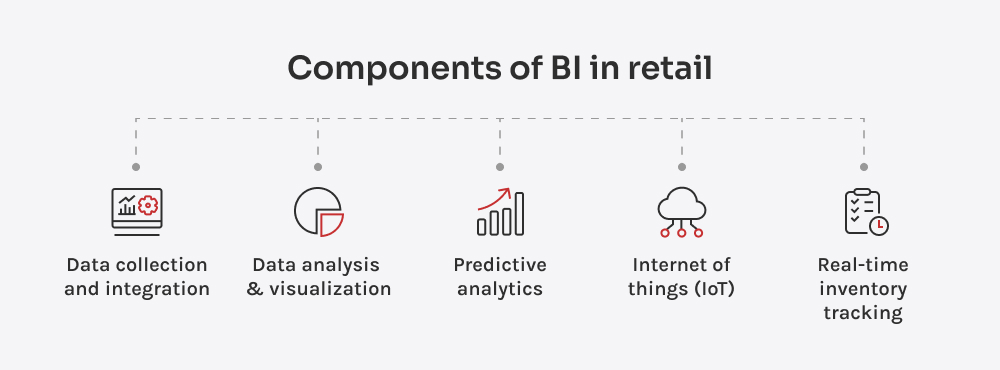
Software de gestão de inventário | NetSuite, Brightpearl, custom IMS | Real-time stock tracking; prevents overstock/stockouts; improves replenishment and cash flow |
CRM software | Salesforce, HubSpot | Deeper customer insights; better segmentation; drives repeat purchases through personalization |
Point of sale (PoS) systems | Square, Lightspeed, Clover | Detects local store patterns; boosts foot traffic and sales with smarter inventory allocation |
Gestão de campanhas de marketing | Mailchimp, Klaviyo, custom tools | Connects campaigns to actual sales and retention; reveals true ROI, not just clicks |
Software de gestão de fornecedores | SAP Ariba, Coupa, vendor portals | Monitors supplier performance; reduces risks; improves supply chain resilience |
IoT smart shelves and sensors | RFID systems, weight sensors, computer vision | Tracks on-shelf availability; catches lost sales early; optimizes shelf space and stock rotation |
Still feeling overwhelmed by where to start or how to scale? Don’t worry — you’re not alone. BI can feel like a lot at first, but with the right guidance, it becomes a powerful asset for your business. Here’s a clear, no-fluff guide to get you moving confidently.
Before touching any tech, get clear on what you want to achieve. Are you trying to reduce inventory costs? Or do you need to Improve customer lifetime value? I put it first just because without specific goals, BI turns into a data dump with pretty dashboards and no direction. Thus, if you set some vague goals — let’s say, “better insights” — it won’t lead you to smarter stocking, pricing, or marketing decisions. I suggest choosing 2–3 specific KPIs (e.g., sell-through rate and customer lifetime value) to focus on first.
You probably already have data sitting across e-commerce platforms, PoS systems, CRM tools, and marketing platforms. Now’s the time to find out what’s available — and what’s missing. Map every data source. Identify which ones you can connect via APIs and which may need custom extraction.
Data ingestion refers to rounding up data from every corner of your business: your CRMs, ERPs, transaction systems, and even outside players like APIs, third-party platforms, and public sources should be included. Next, you need to decide how your systems will talk to each other. Will you stream data in real-time? Batch it daily? Use an ETL (Extract, Transform, Load) tool. My tip here is to work with a reliable IT partner to design a clean, scalable integration plan.
Bad data ruins even good BI. Before visualizing anything, you need to standardize naming conventions, handle missing fields, and align formats across systems. Instead, build a data validation process early. Automate as much cleaning as possible through scripts or BI tool features.
I need to say that no one will use 20 dashboards at once right after you set up BI tools. Data overload paralyzes decision-making. Less is often more. Design dashboards around your goals, not just around what’s possible to measure. Start with a handful that drives action — think sell-through rates, gross margin return on investment (GMROI), basket size growth, or customer lifetime value.
Your BI system is only as good as the people using it. Low adoption kills BI momentum. Everyone from store managers to marketing teams needs to know how to access and interpret the insights. So, invest boldly in onboarding sessions, quick-reference guides, and regular refreshers tailored to each role.
BI isn’t “set it and forget it. Keep optimizing. As your retail business grows, your data needs and goals will evolve. Schedule regular check-ins (I recommend making them quarterly) to review your dashboards, add new KPIs, and retire irrelevant metrics.
Here they are — eight steps that look good on the paper. Even then, it looks like you need to invest some time and effort to set BI that will work for you, not against you. My sincere recommendation is the following: if you feel it’s too much and you don’t have enough resources to address each step as it should be, assign it to the people who know this inside out with the projects successfully done and real client’s feedback. Innowise is that kind of partner — practical, experienced, and focused on BI that actually delivers.
I see business intelligence in retail is all about knowing what actions to take and when to take them. Rolling out a BI system in retail may become your biggest growth lever. The only thing is to do that right. Set clear goals, track the right metrics, avoid unnecessary complications, and simplify where possible. If it feels like too much to take on alone, we’re happy to talk shop and help you.
Director de Tecnologia
Dmitry lidera a estratégia tecnológica por trás das soluções personalizadas que realmente funcionam para os clientes - agora e à medida que crescem. Ele une a visão geral com a execução prática, garantindo que cada construção seja inteligente, escalável e alinhada com o negócio.
Marcar uma chamada ou preencha o formulário abaixo e entraremos em contacto consigo assim que tivermos processado o seu
Por que o Innowise?
2000+
Profissionais de TI
93%
clientes recorrentes
18+
anos de experiência
1300+
projectos bem sucedidos
Ao inscrever-se, o utilizador concorda com a nossa Política de privacidadeincluindo a utilização de cookies e a transferência das suas informações pessoais.
Obrigado!
A sua mensagem foi enviada.
Processaremos o seu pedido e contactá-lo-emos o mais rapidamente possível.
Obrigado!
A sua mensagem foi enviada.
Processaremos o seu pedido e contactá-lo-emos logo que possível.