Please leave your contacts, we will send you our overview by email
I consent to process my personal data in order to send personalized marketing materials in accordance with the Privacy Policy. By confirming the submission, you agree to receive marketing materials
Thank you!

The form has been successfully submitted.
Please find further information in your mailbox.
Innowise is an international full-cycle software development company founded in 2007. We are a team of 2000+ IT professionals developing software for other professionals worldwide.
About us
Innowise is an international full-cycle software development company founded in 2007. We are a team of 2000+ IT professionals developing software for other professionals worldwide.

Data visualization consulting services

Looking to make sense of your data? Our data visualization consultants use cutting-edge tools and tech to build dynamic visualization systems and dashboards. This helps your team spot trends, see patterns, and make smart decisions based on solid data.

40+

launched data visualization projects

Looking to make sense of your data? Our data visualization consultants use cutting-edge tools and tech to build dynamic visualization systems and dashboards. This helps your team spot trends, see patterns, and make smart decisions based on solid data.

40+

launched data visualization projects

  • Complex system integration
  • Customization challenges
  • Data migration issues
  • High costs
  • User adoption
  • Compliance and security
  • Reporting inefficiencies

Complex system integration

Our data integration experts transform scattered data into clear, actionable insights. We connect, clean, and standardize data across platforms – providing you with a complete and unified view for confident decision-making.

Complex system integration

Customization challenges

Our team creates bespoke visualizations to meet your needs. Whether you’re after interactive dashboards, custom reports, or industry-specific visualizations, we’ve got the expertise to deliver the results you deserve.

Customization challengess

Data migration issues

Innowise provides secure and efficient data migration services – meaning minimal downtime, zero data loss, and a smooth transition.

Data migration issues

High costs

Our cost-effective strategies cut down on expenses without sacrificing quality – giving you the insights you need without breaking the bank.

High cost

User adoption

To make sure you have a smooth experience getting started, we’ve got you covered with detailed guides, hands-on training, and ongoing support whenever you need it.

User adoption

Compliance and security

Our experts safeguard your data with advanced security measures: think tight access controls, solid encryption, and thorough audit logs meaning you’re fully up to code with regulatory compliance.

Compliance and security

Reporting inefficiencies

We offer cutting-edge data visualization solutions that automate reporting, provide real-time data insights, and enable interactive data exploration.

Compliance and security
Complex system integration

Our data integration experts transform scattered data into clear, actionable insights. We connect, clean, and standardize data across platforms – providing you with a complete and unified view for confident decision-making.

Customization challenges

Our team creates bespoke visualizations to meet your needs. Whether you’re after interactive dashboards, custom reports, or industry-specific visualizations, we’ve got the expertise to deliver the results you deserve.

Data migration issues

Innowise provides secure and efficient data migration services – meaning minimal downtime, zero data loss, and a smooth transition.

High costs

Our cost-effective strategies cut down on expenses without sacrificing quality – giving you the insights you need without breaking the bank.

User adoption

To make sure you have a smooth experience getting started, we’ve got you covered with detailed guides, hands-on training, and ongoing support whenever you need it.

Compliance and security

Our experts safeguard your data with advanced security measures: think tight access controls, solid encryption, and thorough audit logs meaning you’re fully up to code with regulatory compliance.

Reporting inefficiencies

We offer cutting-edge data visualization solutions that automate reporting, provide real-time data insights, and enable interactive data exploration.

Get comprehensive data visualization consulting services

At Innowise, we get it: making the most of your data and driving informed decision-making depends on having the right tools. Using high-quality inputs, efficient management processes, and the right visualization and reporting tools, our expert data visualization consultants are here to guide you through these complexities and help you reach your goals.
  • BI solution development
We build and set up BI solutions using advanced tools like Tableau and Power BI. This means you get real-time data and analytics for better -informed business decisions.
  • Data preparation
Our data visualization experts handle the hard work: we collect, cleanse, and structure data from various sources – such as databases, APIs, and CRMs – to make sure your analyses are accurate and reliable.
  • Visualization implementation
At Innowise, we design interactive data visualizations like charts, graphs, dashboards, and maps tailored to your specific needs, providing clear and insightful ways to better understand what your data means.
  • Custom dashboard creation
Our team designs, develops and optimizes custom dashboards and reports – making sure that everyone in your organization can access the right information in the best way possible.
  • Data analytics
At Innowise, we employ advanced data technologies such as ML and AI to uncover hidden trends, patterns, and relationships in data – driving invaluable insights and supporting strategic decision-making.
  • Visualization optimization
We use tried-and-tested best practices and modern technologies like data simplification and efficient rendering to make your visualizations fast, clear, and interactive – making sure they perform at their best.
Pilip Tsikhanovich Head of Big Data Department at Innowise
“Data visualization isn't just about good-looking graphs; it's about how a business communicates with data. At Innowise, we firmly believe that every business deserves a clear and compelling interpretation of its insights. Our experts turn raw numbers into interactive storytelling – uncovering hidden opportunities, driving evidence-based decisions, and giving our clients a competitive edge.”

Data visualization solutions we leverage

At Innowise, our team creates interactive and informative data visualizations using a wide variety of advanced platforms and tools – meaning our clients are able to easily interpret and use their data for maximum impact.
Tableau

Tableau

Power BI

Power BI

Qlik

Qlik

Looker

Looker

Microsoft Excel

Microsoft Excel

Grafana

Grafana

Chartist.Js

Chartist.js

MicroStrategy

MicroStrategy

Chartblocks

Chartblocks

Infogram

Infogram

Data Wrapper

Data Wrapper

Looker Studio

Looker Studio

D3.Js

D3.js

Plotly/Dash

Plotly/Dash

Streamlit

Streamlit

Flourish

Flourish

AWS Quicksight

AWS Quicksight

Types of visual displays we use

Innowise knows just how to pick the right way to show your data for every task. Our experts can turn any data into all kinds of visuals – charts, tables, graphs, maps, dashboards. You name it, we’ve got you covered.
pie

Pie chart

pie

Bar chart

pie

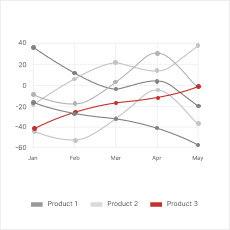
Line chart

pie

Histogram

pie

Gantt chart

pie

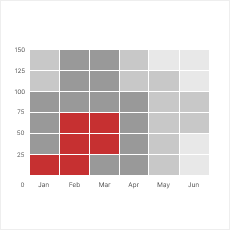
Heat map

pie

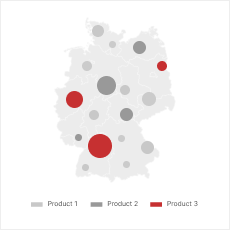
Choropleth map

pie

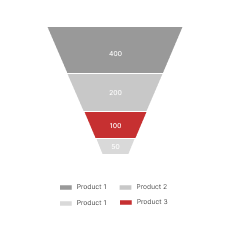
Funnel chart

pie

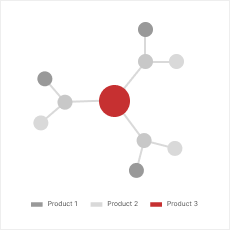
Network diagrams

pie

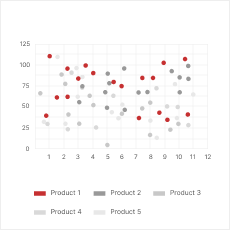
Scatterplot

pie

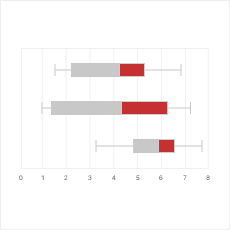
Box and whisker plot

pie

Waterfall chart

pie

Area chart

pie

Correlation matrix

pie

Pivot table

Cutting-edge technologies for improving data visualization

Real-time data visualization

Interactive and immersive visualizations

Overview

Converting raw data into visuals in real time means you’ll gain instant insights – letting you make smart decisions fast.
By using interactive features, AR, and VR, you can turn complex data into engaging and immersive experiences.

Impact

If you’re in industries where timing is everything – like finance, retail, or manufacturing – real-time data visualization is a must.
This tech lets users interact with data in fresh, intuitive ways – significantly improving user experience, comprehension, and retention.

Example

Interactive dashboards with live metrics and KPIs provide a clear, up-to-date snapshot of how your business is doing.
Medical VR apps like VOKA let students explore the human body in 3D, interact with organs and systems, and gain a much clearer understanding of anatomy.

Why choose Innowise as a data visualization consulting company

By choosing Innowise as your data visualization consulting partner, you’re gaining a trusted advisor who’s committed to helping you make the most of your data. Thanks to our years of experience and first-rate team of experts, we keep our clients happy by delivering innovative and effective solutions that generate valuable insights, support data-driven decision-making, and ultimately drive business growth.
Component 328

Tailored solutions

Innowise’s team creates custom dashboards, comprehensive reports, interactive maps, and specific visualizations that perfectly align with your KPIs and business processes.
Component 328 (1)

Cutting-edge technology

Blending ML and AI algorithms with cutting-edge technologies, we uncover hidden patterns and insights, creating interactive, dynamic visualizations that boost your bottom line.
Component 328 (2)

Customer-focus approach

We handle each and every detail and deliver tried-and-tested solutions that don’t just meet, but exceed your expectations -resulting in long-term partnerships and sustained success.
Component 328 (3)

All-in-one services

From your first consultation and design to smooth implementation and ongoing support, our experts make sure that all your needs are handled with precision and care.
Component 328 (4)

Expert team

We’ve got your back with our team of world-class data scientists, engineers, and visualization experts – and their proven track record in delivering successful projects.
Component 328 (5)

Cost-effectiveness

At Innowise, we offer flexible engagement models and competitive pricing to fit your budget, guaranteeing you receive the greatest value for your investment without breaking the bank.

Our partnerships and awards

awards
awards
awards
awards
awards
awards
awards
awards
awards
awards
awards
awards
awards
awards
awards
awards
awards
awards
awards
awards
awards
awards awards awards awards awards awards awards awards awards awards

Show all

Show less

Industries we serve

At Innowise, we know data inside out. As an experienced data visualization consulting company, we help our clients turn numbers into stories. Whether you’re in finance, healthcare, or any other field, we provide custom-made solutions that fit your unique needs. Our goal? To give you measurable results and improve your overall business health.
Retail and eCommerce

We help retailers and eCommerce companies get a handle on analyzing buying trends and managing inventory through interactive dashboards and comprehensive reports – ultimately optimizing sales and marketing strategies.

  • Increase sales and profitability
  • Improve customer retention
  • Optimize your marketing budget
Manufacturing

Our team delivers state-of-the-art tools for keeping an eye on production processes and equipment efficiency – cutting back on downtime and ramping up productivity.

  • Monitor equipment performance
  • Predict customer demand
  • Identify areas for improvement
Finance and banking

Innowise develops data visualization systems for digging into financial performance, managing risks, and catching fraud – helping organizations cut financial losses and make the most out of their assets.

  • Track revenue and spending
  • Identify and manage financial risks
  • Stay on top of financial flows
Telecommunications

Our team is all about making the most out of network resources, spotting and fixing network failures, and giving customers a first-class experience with easy-to-understand data on network activity and service usage.

  • Optimize network infrastructure
  • Improve service quality
  • Keep customers coming back
Education

We develop custom data visualization tools that support in-depth analysis of student performance and program effectiveness – pinpointing any problem areas and developing evidence-based strategies for improvement.

  • Improve student engagement
  • Make teaching more effective
  • Optimize resource allocation
Government

Our specialists create advanced data visualization systems to track and evaluate government programs, aiming to improve transparency, make better use of resources, and boost public trust.

  • Deliver better public services
  • Increase transparency and accountability
  • Improve citizen satisfaction
Energy and utilities

At Innowise, we help energy and utility companies clients get the most out of their resources and predict future needs – tackling issues related to excessive energy consumption and aging infrastructure.

  • Optimize energy consumption and production
  • Improve grid reliability and resilience
  • Reduce costs and environmental impact
Healthcare and pharma

Our approach to custom data visualization solutions means a big boost in clinical data analytics and operational efficiency – driving improvements in healthcare quality, and expediting the time-to-market for new drugs.

  • Improve the quality of medical care
  • Accelerate drug development
  • Streamline clinical trials
Transportation and logistics

At Innowise, we equip transportation and logistics companies with data visualization tools that make managing routes, fleets, and supply chains a breeze. Our tools help streamline your operations, cut costs, and get things delivered faster.

  • Fine-tune shipping routes and schedules
  • Boost fleet management
  • Improve supply chain visibility
Konstantin Kobialko Business development manager
Turn your data into actionable insights Let Innowise transform your data into a competitive advantage.

Our approach to data visualization consulting services

At Innowise, we’re committed to providing customer data visualization solutions that are simple, clear, and impactful. Our approach? To deliver measurable results and maximize value for your business.
  • Risk-proof project scoping
Our experts take a hands-on approach to project planning – proactively defining and managing scope to avoid any surprises and ensure your project stays on track and within budget.
  • Accurate cost estimation
We delve deep into project analysis from various perspectives in order to pinpoint any potential risks and provide accurate cost forecasts – helping clients plan and budget effectively.
  • Collaborative environment
We believe in working closely together every step of the way. Open communication, transparency, and mutual respect among all stakeholders are at the heart of our ethos.
  • Uncompromising quality
We guarantee high-quality solutions, thanks to our rigorous quality control throughout the entire software development life cycle. We quickly address any issues that arise before they have a chance to become real problems.
  • Measurable success
We team up with our clients to nail down a set of success markers and KPIs: this way, we keep a clear eye on project progress and make reporting and evaluation that much easier.
  • Top security
We set up a comprehensive security management system designed to safeguard and protect our client’s project environment, software, and data – meaning you can rest assured knowing your project is in safe hands.
Team Our data visualization consultants have the expertise and experience under their belts to turn your data into compelling narratives.

Get these benefits with Innowise

50%
Increase in data insight capabilities

We tap into advanced tools like Tableau, Power BI, and Qlik Sense, as well as ML and statistical analysis.

40%
Improvement in operational efficiency

Due to Innowise’s custom solutions, our clients receive real-time insights into key metrics and bottlenecks.

35%
Increase in user adoption rates

Thanks to our team of experts, we’re pros at creating highly intuitive, user-friendly visualizations tailored to diverse user roles.

30%
Reduction in costs associated

We help you with automation, cloud technology, and process optimization - saving you time and effort and keeping your wallet happy.

Our implementation roadmap

At Innowise, we’ve got a solid game plan for every data visualization project. We follow a systematic and thorough approach, providing complete implementation and ongoing support – making sure we cover all bases from start to finish. Our process features several key steps, each designed to maximize efficiency and deliver high-quality results.
Requirement gathering
  • Identify goals and audience
  • Evaluate data sources
  • Define project scope
Data analysis and preparation
  • Gather necessary data
  • Remove data errors
  • Format for visualization
Design and prototyping
  • Develop visualization strategy
  • Choose visualization tools
  • Create wireframes and mockups
Development and implementation
  • Build and test visualizations
  • Add interactive features
  • Integrate with systems
Review and refinement
  • Collect stakeholder feedback
  • Refine visualizations
  • Fine-tune goal alignment
Deployment and training
  • Deploy visualizations
  • Provide documentation
  • Train end-users
Support and maintenance
  • Address issues and implement updates
  • Improve visualizations as needed
01 Manager assignment
1-2 hours Once we’ve received your initial request, we’ll assign a dedicated sales manager to act as your main point of contact and clarify any details if needed.
02 Resume screening
1-2 days We cherry-pick the resumes of skilled Python developers that match your requirements and send them off to you for preliminary approval.
03 Interview setup
(optional on request) Upon request, you can schedule interviews with potential candidates to ensure a perfect fit for your project needs.
04 Team assembly
1-2 weeks If you require a full project team, we will put together a cohesive team with complementary skills to kick off the project.
05 MVP development
2-3 months Within this time frame, we’ll whip up and launch your MVP.
06 Full development
3-12 months We deliver a fully-developed Python solution, according to your specifications.
07 Continuous support
Lifetime We’re in this for the long haul. We’ll continuously fine-tune and adapt your app to align with evolving market trends, preferences, and user needs over its lifetime.
Requirement gathering
  • Identify goals and audience
  • Evaluate data sources
  • Define project scope
Data analysis and preparation
  • Gather necessary data
  • Remove data errors
  • Format for visualization
Design and prototyping
  • Develop visualization strategy
  • Choose visualization tools
  • Create wireframes and mockups
Development and implementation
  • Build and test visualizations
  • Add interactive features
  • Integrate with systems
Review and refinement
  • Collect stakeholder feedback
  • Refine visualizations
  • Fine-tune goal alignment
Deployment and training
  • Deploy visualizations
  • Provide documentation
  • Train end-users
Support and maintenance
  • Address issues and implement updates
  • Improve visualizations as needed

Core technologies we work with

  • Tableau
  • Looker Studio
  • Microsoft Power BI
  • Looker
  • QuickSight
  • Qlik Sense
  • QlikView
  • Datawrapper
  • Metabase
  • Apache Superset
  • Infogram
  • D3.js
  • Plotly/Dash
  • Streamlit
  • Flourish
  • Microsoft Excel
  • Grafana
  • Chartist.js
  • MicroStrategy
  • Chartblocks
  • Python
  • RAWGraphs
  • JavaScript
  • Angular
  • React.js
  • Vue.js
  • Matplotlib
  • Plotly
  • Seaborn
  • Plotnine / GGplot
  • Bokeh
  • Pygal
  • Geoplotlib
  • D3.js
  • High Charts
  • Chart.js
  • Fusion Charts
  • Chartlist.js
  • Recharts
  • Google Charts
  • Streamlit
  • AWS
  • Microsoft Azure
  • Google Cloud Platform
  • Microsoft SQL Server
  • PostgreSQL
  • MongoDB
  • MariaDB
  • MySQL
  • Cassandra
  • Clickhouse
  • Neo4j
  • Redis
  • Aurora
  • DynamoDB
  • Redshift
  • RDS
  • Snowflake
  • DocumentDB
  • Synapse
  • Cosmo DB
  • Google BigQuery
  • Cloud Bigtable
  • Amazon S3
  • Amazon DynamoDB
  • Amazon DocumentDB
  • Azure Cosmos DB
  • Azure Blob Storage
  • Azure Data Lake
  • Azure Data Factory
  • Google Cloud Datastore
  • Memorystore
  • Apache Hadoop
  • Apache Spark
  • Apache Cassandra
  • Apache Kafka
  • Apache ZooKeeper
  • Apache HBase

What our customers think

Or Iny CEO Zero Beta
company's logo

“We are delighted with Innowise's commitment to delivering quality work and solving issues quickly. They lead an engaged approach to understanding the team's needs and accomplishing their goals.”

  • Industry Financial services
  • Team size 9 specialists
  • Duration 12 months
  • Services Custom software development
EGzon Gajtani Strategic Projects Tangoo Professional Network
company's logo

“We were highly satisfied with the outcome of the project and the deliverables that Innowise delivered. They were highly responsive and timely in their communication, which allowed for smooth and efficient collaboration.”

  • Industry IT services
  • Team size 2 specialists
  • Duration 6 months
  • Services IT staff augmentatio
Dominik Märkl Director OneStop Pro
company's logo

“When it comes to handling pressure situations, Innowise has always proven their deftness in managing these situations. They do this by having clear understanding of our expected results to take our business towards growth and customer satisfaction.”

  • Industry IT services
  • Team size 7 specialists
  • Duration 36+ months
  • Services Custom software development

FAQ

With our data visualization consulting services, we use advanced tools like Tableau and Power BI to offer clear, actionable insights and interpretations of KPIs. This means you can get real-time tracking of your business operations – making the decision-making process that much more efficient.
We prioritize the security of your data through robust measures like VPNs, SSL/TLS encryption, and tight access controls. Thanks to our comprehensive auditing tools, each and every one of our projects stick to GDPR, HIPAA, CCPA, and other regulatory standards – guaranteeing the protection of data and fulfillment of all security obligations.
Absolutely! At Innowise, we build bespoke data visualization solutions designed to align with the unique business challenges within your industry. This maximizes your data usage while also integrating these custom solutions into your existing ERP, CRM, and database systems – dramatically improving overall performance.
Innowise’s data visualization consulting projects start by pinpointing your specific goals and gathering essential requirements. Our expert team then moves on to design a bespoke data model and develop a robust visualization architecture tailored to your needs. Following this, we’ll create and refine prototypes for your review and approval. Once you’ve given us the green light, we integrate our visualization system with your existing data infrastructure. We then conduct rigorous testing, followed by a headache-free deployment of your solution.
In short, the timeline required to finalize a data visualization project really depends on its complexity and the volume of data involved. Generally speaking, this kind of projects can take anywhere from a few weeks to several months. At Innowise, we’re all about detailed planning: it’s at the core of our project management strategy. We dig into all technical and operational elements –, streamlining our workflows to guarantee adherence to predefined deadlines and budget constraints – resulting in high-quality project delivery without compromising on quality.

Feel free to book a call and get all the answers you need.

Schedule a call

Contact us!

Book a call or fill out the form below and we’ll get back to you once we’ve processed your request.

    Please include project details, duration, tech stack, IT professionals needed, and other relevant info
    Record a voice message about your
    project to help us understand it better
    Attach additional documents as needed
    Upload file

    You can attach up to 1 file of 2MB overall. Valid files: pdf, jpg, jpeg, png

    Please be informed that when you click the Send button Innowise will process your personal data in accordance with our Privacy Policy for the purpose of providing you with appropriate information.

    Why Innowise?

    2000+

    IT professionals

    93%

    recurring customers

    18+

    years of expertise

    1300+

    successful projects

    Need other services?

    Спасибо!

    Cообщение отправлено.
    Мы обработаем ваш запрос и свяжемся с вами в кратчайшие сроки.

    Thank you!

    Your message has been sent.
    We’ll process your request and contact you back as soon as possible.

    Thank you!

    Your message has been sent. 

    We’ll process your request and contact you back as soon as possible.

    arrow