The form has been successfully submitted.
Please find further information in your mailbox.
Innowise enhanced a client’s thermal analysis web app by improving code quality, upgrading 3D model visualization, and adding new features.
Our client develops thermal design modeling software, which allows engineers to see how well their designs perform under high temperatures. The engineers upload and configure 3D models of product parts, which are then sent to a supercomputer for processing and simulation. The web application analyzes these models to identify the features such as temperature distribution, heat dissipation, fluid flow, thermal resistance, thermal radiation, cooling capacity, etc. This way, the engineers can save resources on prototypes and test their designs via software.
Detailed information about the client cannot be disclosed under the terms of the NDA.
Our client came to us with several issues: their software for thermal analysis performed poorly, and the 3D models weren’t loading correctly, with some models not appearing at all. The web app also struggled to effectively visualize thermal relationships between different parts and present analysis results. The issues made it difficult for users to interpret and use the data efficiently.
Innowise improved its client’s software by analyzing existing code, fixing errors, and adding new features. We found problems in the code and made it cleaner to improve the overall software performance. Our team of experts also upgraded 3D models’ quality and introduced new features like a thermal network page and design evolution tools to further improve product development process.
Our software engineers conducted a thorough assessment of the existing codebase. This process involved a deep dive into the structure, functionality, and overall health of the code. We used static code analysis tools like ESLint and SonarQube to automatically detect potential issues, followed by a manual review to catch anything that automated tools might have missed. Innowise team reviewed the findings and compiled a detailed outline of the problems and our recommended solutions.
Since code refactoring is crucial for maintaining a healthy codebase, we focused on improving the code’s readability and performance first. These improvements made it easier for developers to understand and build upon the code in the future.
Fixing errors was essential for keeping the software running smoothly and reliably. By solving bugs and issues, we improved the software’s stability and made it better for users.
To tackle issues with 3D model visualization in our client’s software for thermal analysis, we integrated the vtk.js library, which is less resource-intensive. This guaranteed that all models loaded correctly and were displayed accurately.
Our team also addressed model rendering issues by analyzing the rendering pipeline, fixing bugs, and optimizing algorithms. This included improving mesh generation, texture mapping, and shading, so that models were displayed accurately and efficiently.
To further enhance the application’s capabilities, we introduced several new features destined to improve user experience and provide deeper insights into thermal performance.
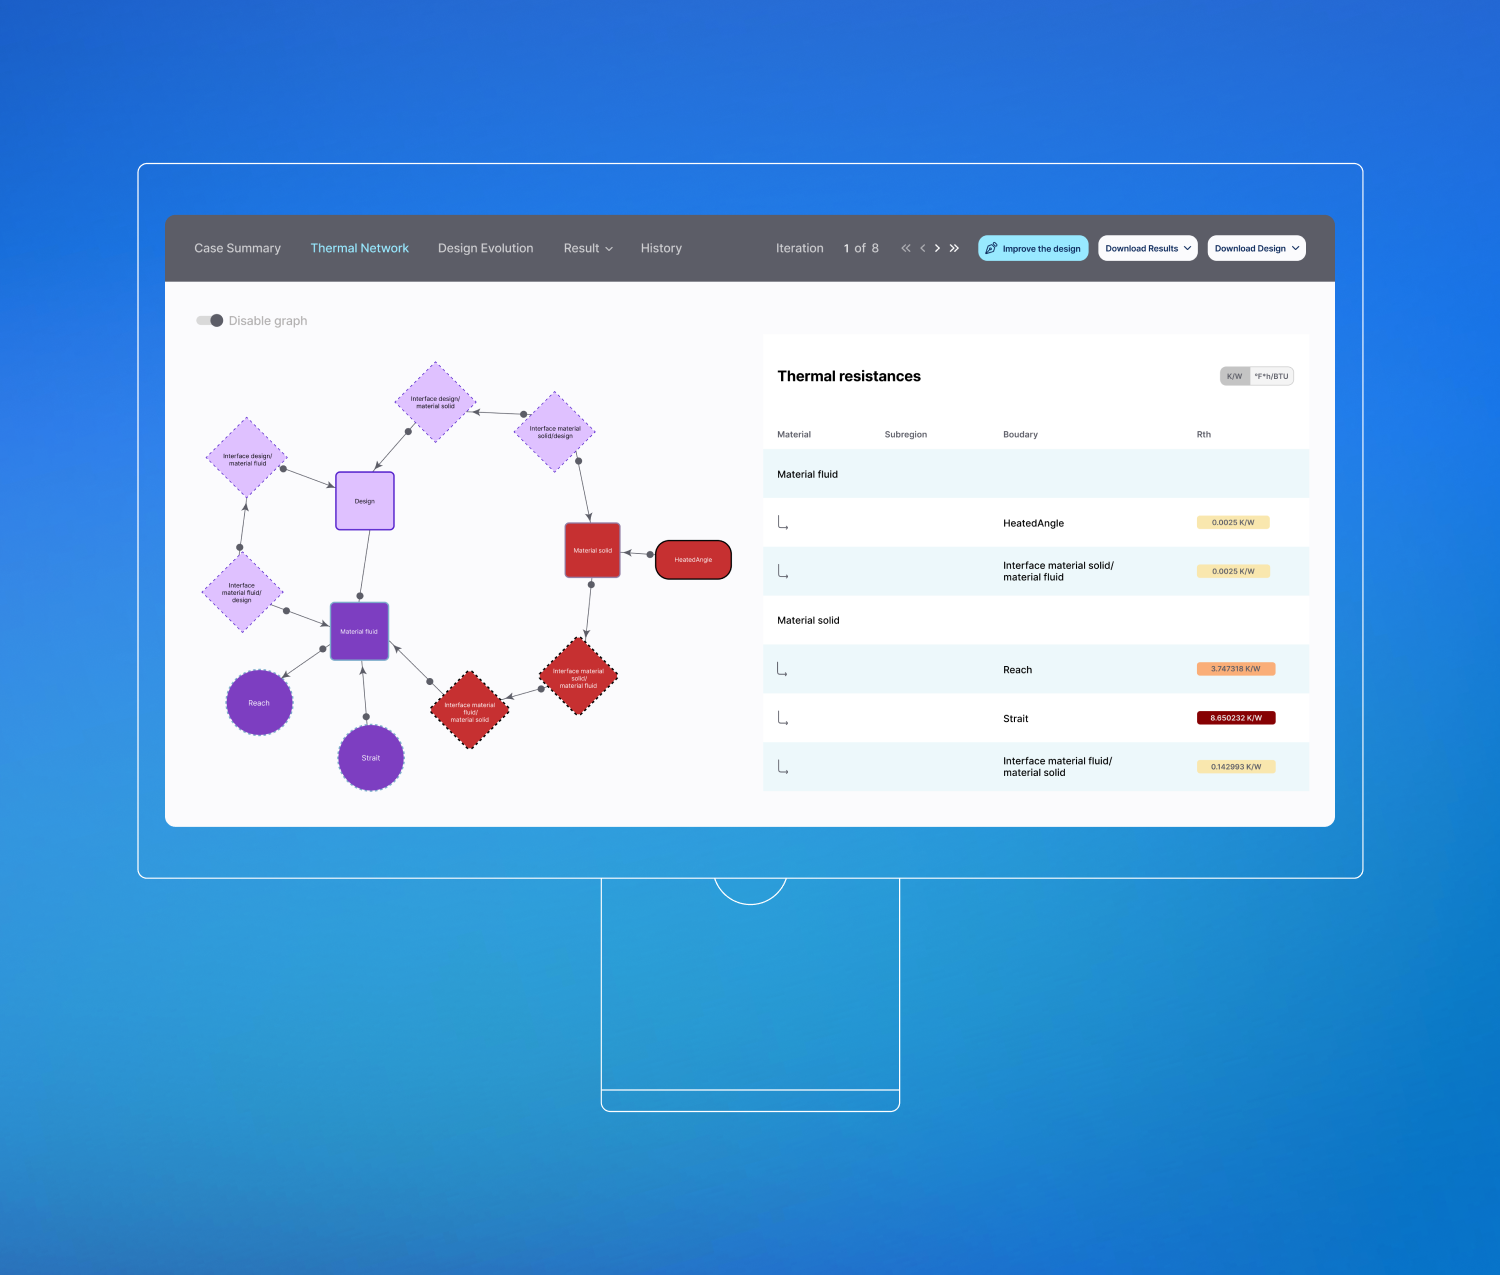
Our software engineers created a new thermal network page that uses interactive graphs to illustrate thermal relationships between different parts of a product. This visualization provides users with a clearer and more intuitive understanding of how heat is distributed and transferred within their design. Users can now see the thermal interactions in a graphical format, making it easier to identify potential hotspots. The page allows for zooming and panning so that users can focus on specific areas of interest and analyze the thermal performance in detail.
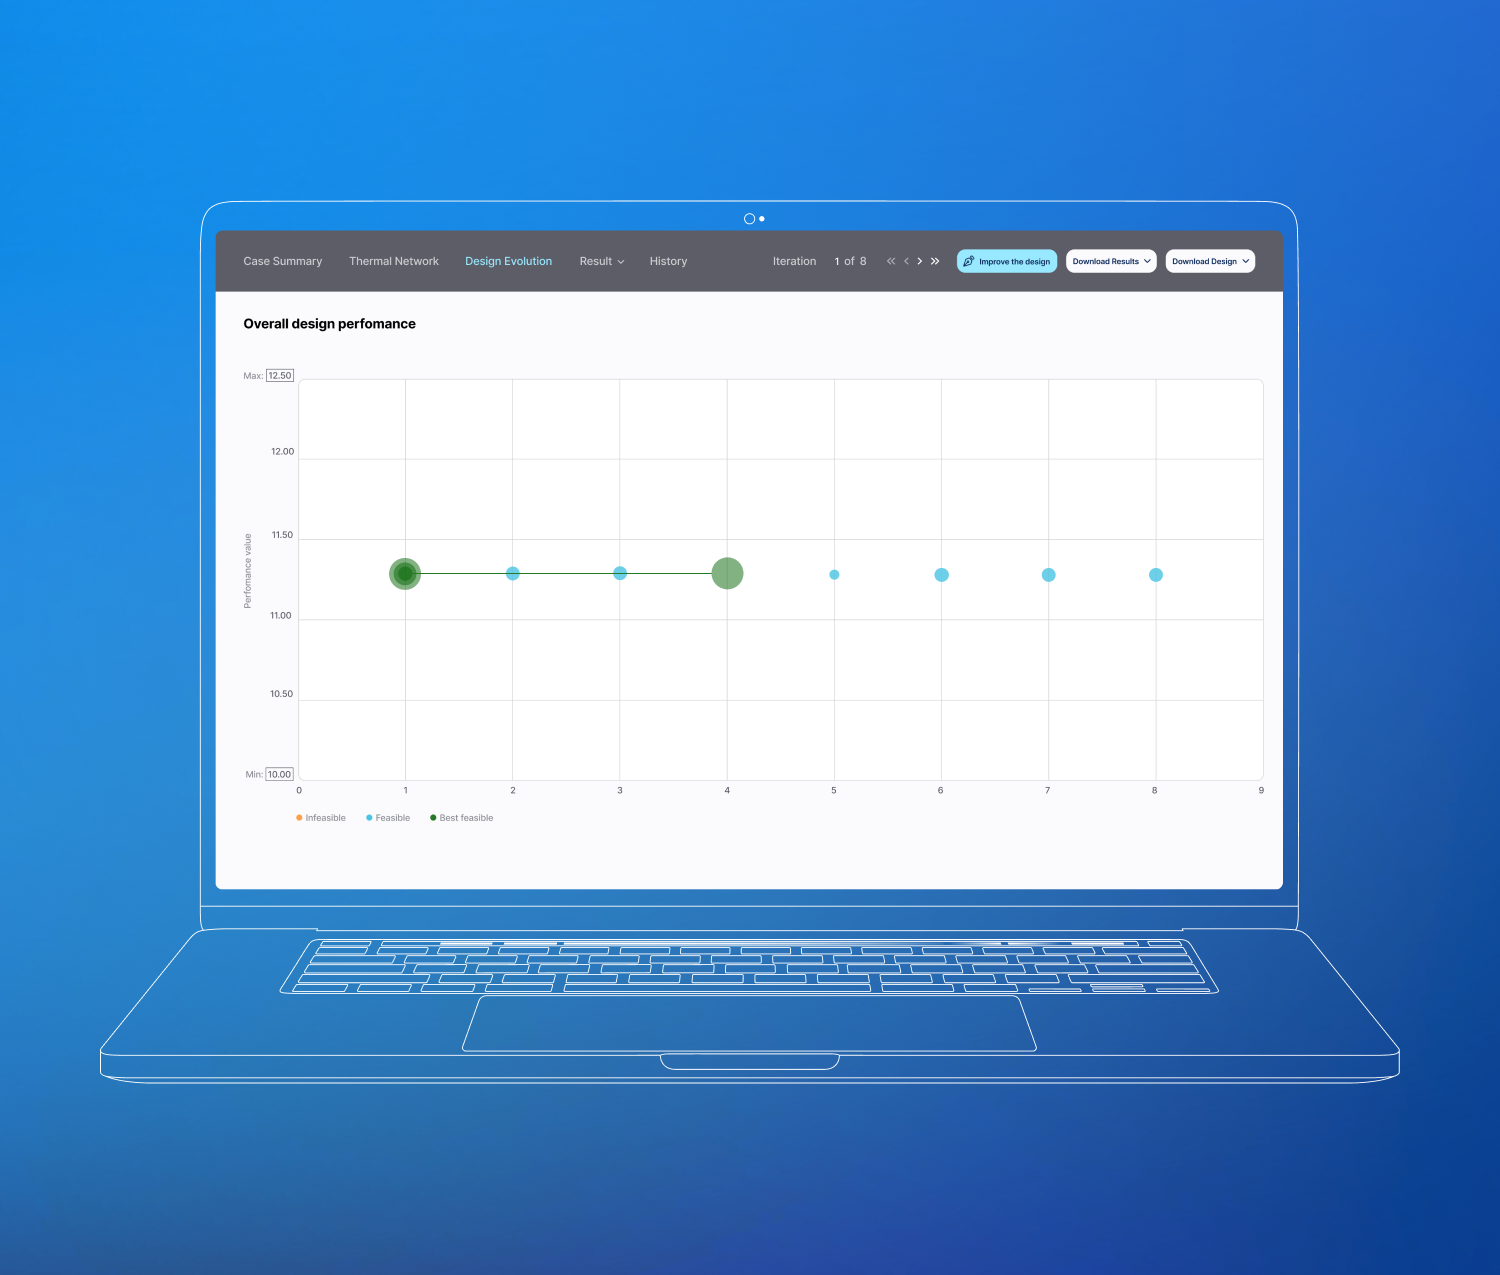
Afterward, we added a design evolution feature that enables users to track and compare the evolution of their designs over multiple iterations. This feature is particularly useful for those who need to evaluate the impact of design changes on thermal performance. Users can save different iterations of their simulations, compare them side by side, and select the best version based on the results. The design evolution page includes a timeline view, which visually represents the progression of design modifications and their corresponding simulation outcomes. Users can download the settings of the best iteration, facilitating easier documentation and implementation of the optimal design.
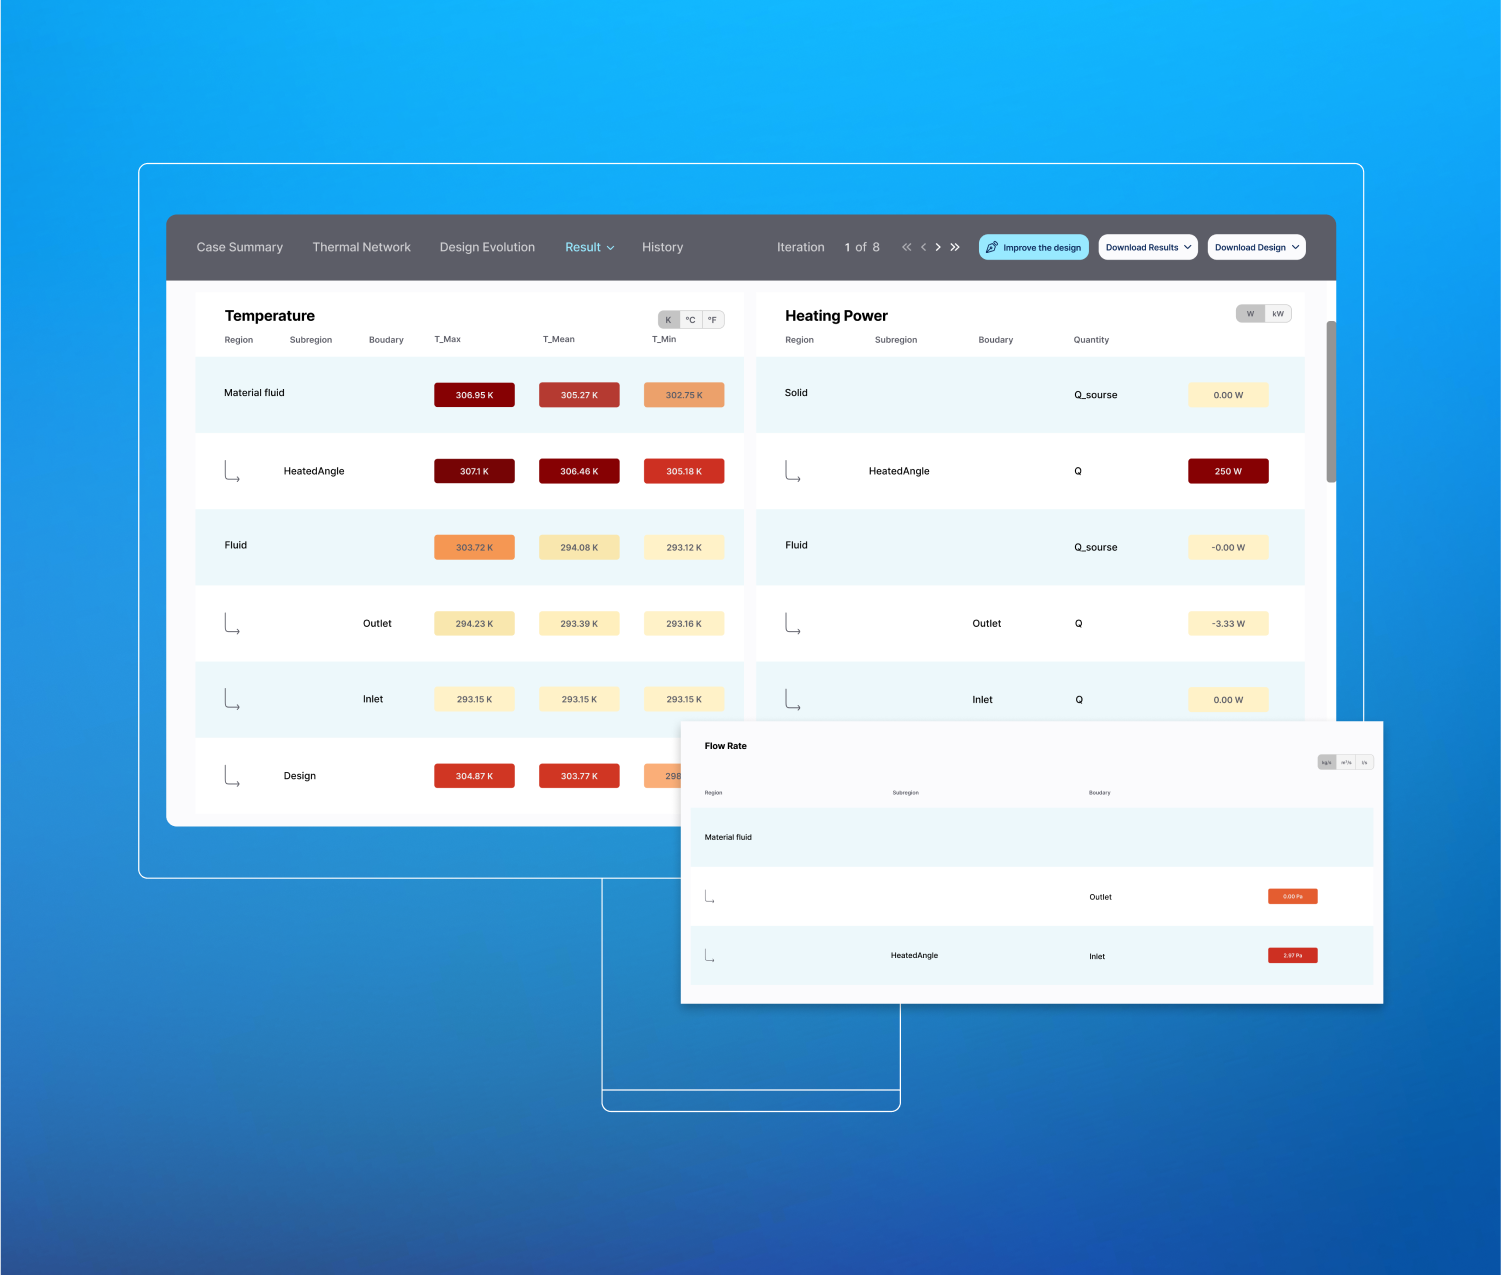
Our professionals made data easier to understand by using tables and graphs. This approach gives clear information about crucial things like temperature, pressure, and flow rate. Users can see the results without sorting through messy data. The tables have options to sort and filter so users can focus on specific details. Graphs show trends and patterns that help users spot important insights quickly. We also added features like tooltips and zooming to make the graphs more interactive and user-friendly.
Backend
Frontend
Javascript, Vue 3, Nuxt 3, Vuex, vtk.js, D3.js
Databases
PostgreSQL
AWS (EKS, ECS, ECR, CloudWatch, EC2, S3, RDS, Amazon MQ, etc.), GitLab, Terraform
GitLab CI
Our development process was divided into several phases to keep the project organized and maintain close collaboration with the client. By using Agile and Kanban methodologies, we could adapt quickly to changes and prioritize tasks effectively. This ensured that the project stayed on track and met client needs.
In the discovery phase, we conducted an initial assessment of the codebase and gathered detailed client requirements. The main deliverable was a Vision and Scope document outlining the project goals and objectives.
During this stage, our expert team created detailed wireframes and prototypes for the new features and improvements. Key deliverables included a customer journey map and a clickable prototype of the new pages.
Then, our developers implemented code refactoring, integrated VTK.js for 3D models, and created new features. Deliverables included an updated codebase, fully functional new features, and enhanced 3D model visualizations.
The following stage involved rigorous testing, including unit, integration, and user acceptance tests, to ensure functionality and reliability.
Finally, we deployed the updated application to the client’s environment and provided post-deployment support.
Our team held daily stand-up meetings to discuss progress and resolve issues promptly, which helped us maintain momentum and prevent delays. We used Jira to manage tasks and track progress transparently, while Slack facilitated direct and continuous communication with the client. This approach allowed us to address client needs promptly and keep the project moving forward efficiently.
2
Front-End Engineers
2
Back-End Engineers
2
Team Leads
1
QA
1
AQA
1
UI/UX Designer
1
DevOps
40%
reduction in thermal data analysis time
60%
faster web app loading
Having received and processed your request, we will get back to you shortly to detail your project needs and sign an NDA to ensure the confidentiality of information.
After examining requirements, our analysts and developers devise a project proposal with the scope of works, team size, time, and cost estimates.
We arrange a meeting with you to discuss the offer and come to an agreement.
We sign a contract and start working on your project as quickly as possible.
© 2007-2024 Innowise. All Rights Reserved.
Privacy Policy. Cookies Policy.
Innowise Sp. z o.o Ul. Rondo Ignacego Daszyńskiego, 2B-22P, 00-843 Warsaw, Poland
By signing up you agree to our Privacy Policy, including the use of cookies and transfer of your personal information.
Thank you!
Your message has been sent.
We’ll process your request and contact you back as soon as possible.
Thank you!
Your message has been sent.
We’ll process your request and contact you back as soon as possible.