The form has been successfully submitted.
Please find further information in your mailbox.
Innowise executed a multifaceted medical research software upgrade for an ontology provider, incorporating AI-driven search, custom data dashboards, and ontology integration into a chemical research company’s infrastructure.
Our client, a leading entity in the ontology domain, operates in Germany. The company specializes in the development of technologies that extract information from structured and unstructured data, transforming it into knowledge for research, discoveries, and decision-making. Their expertise spans across chemistry, biology, and related scientific fields. They own a vast ontology system, a structured framework of interconnected scientific terms and concepts.
Detailed information about the client cannot be disclosed under the terms of the NDA.
The primary challenges our client faced centered around three main areas: developing a front end for their AI-powered search system, automating data visualization within medical research software, and integrating their ontologies into an existing chemical research company’s system:
Innowise’s team focused on three key aspects of the project:
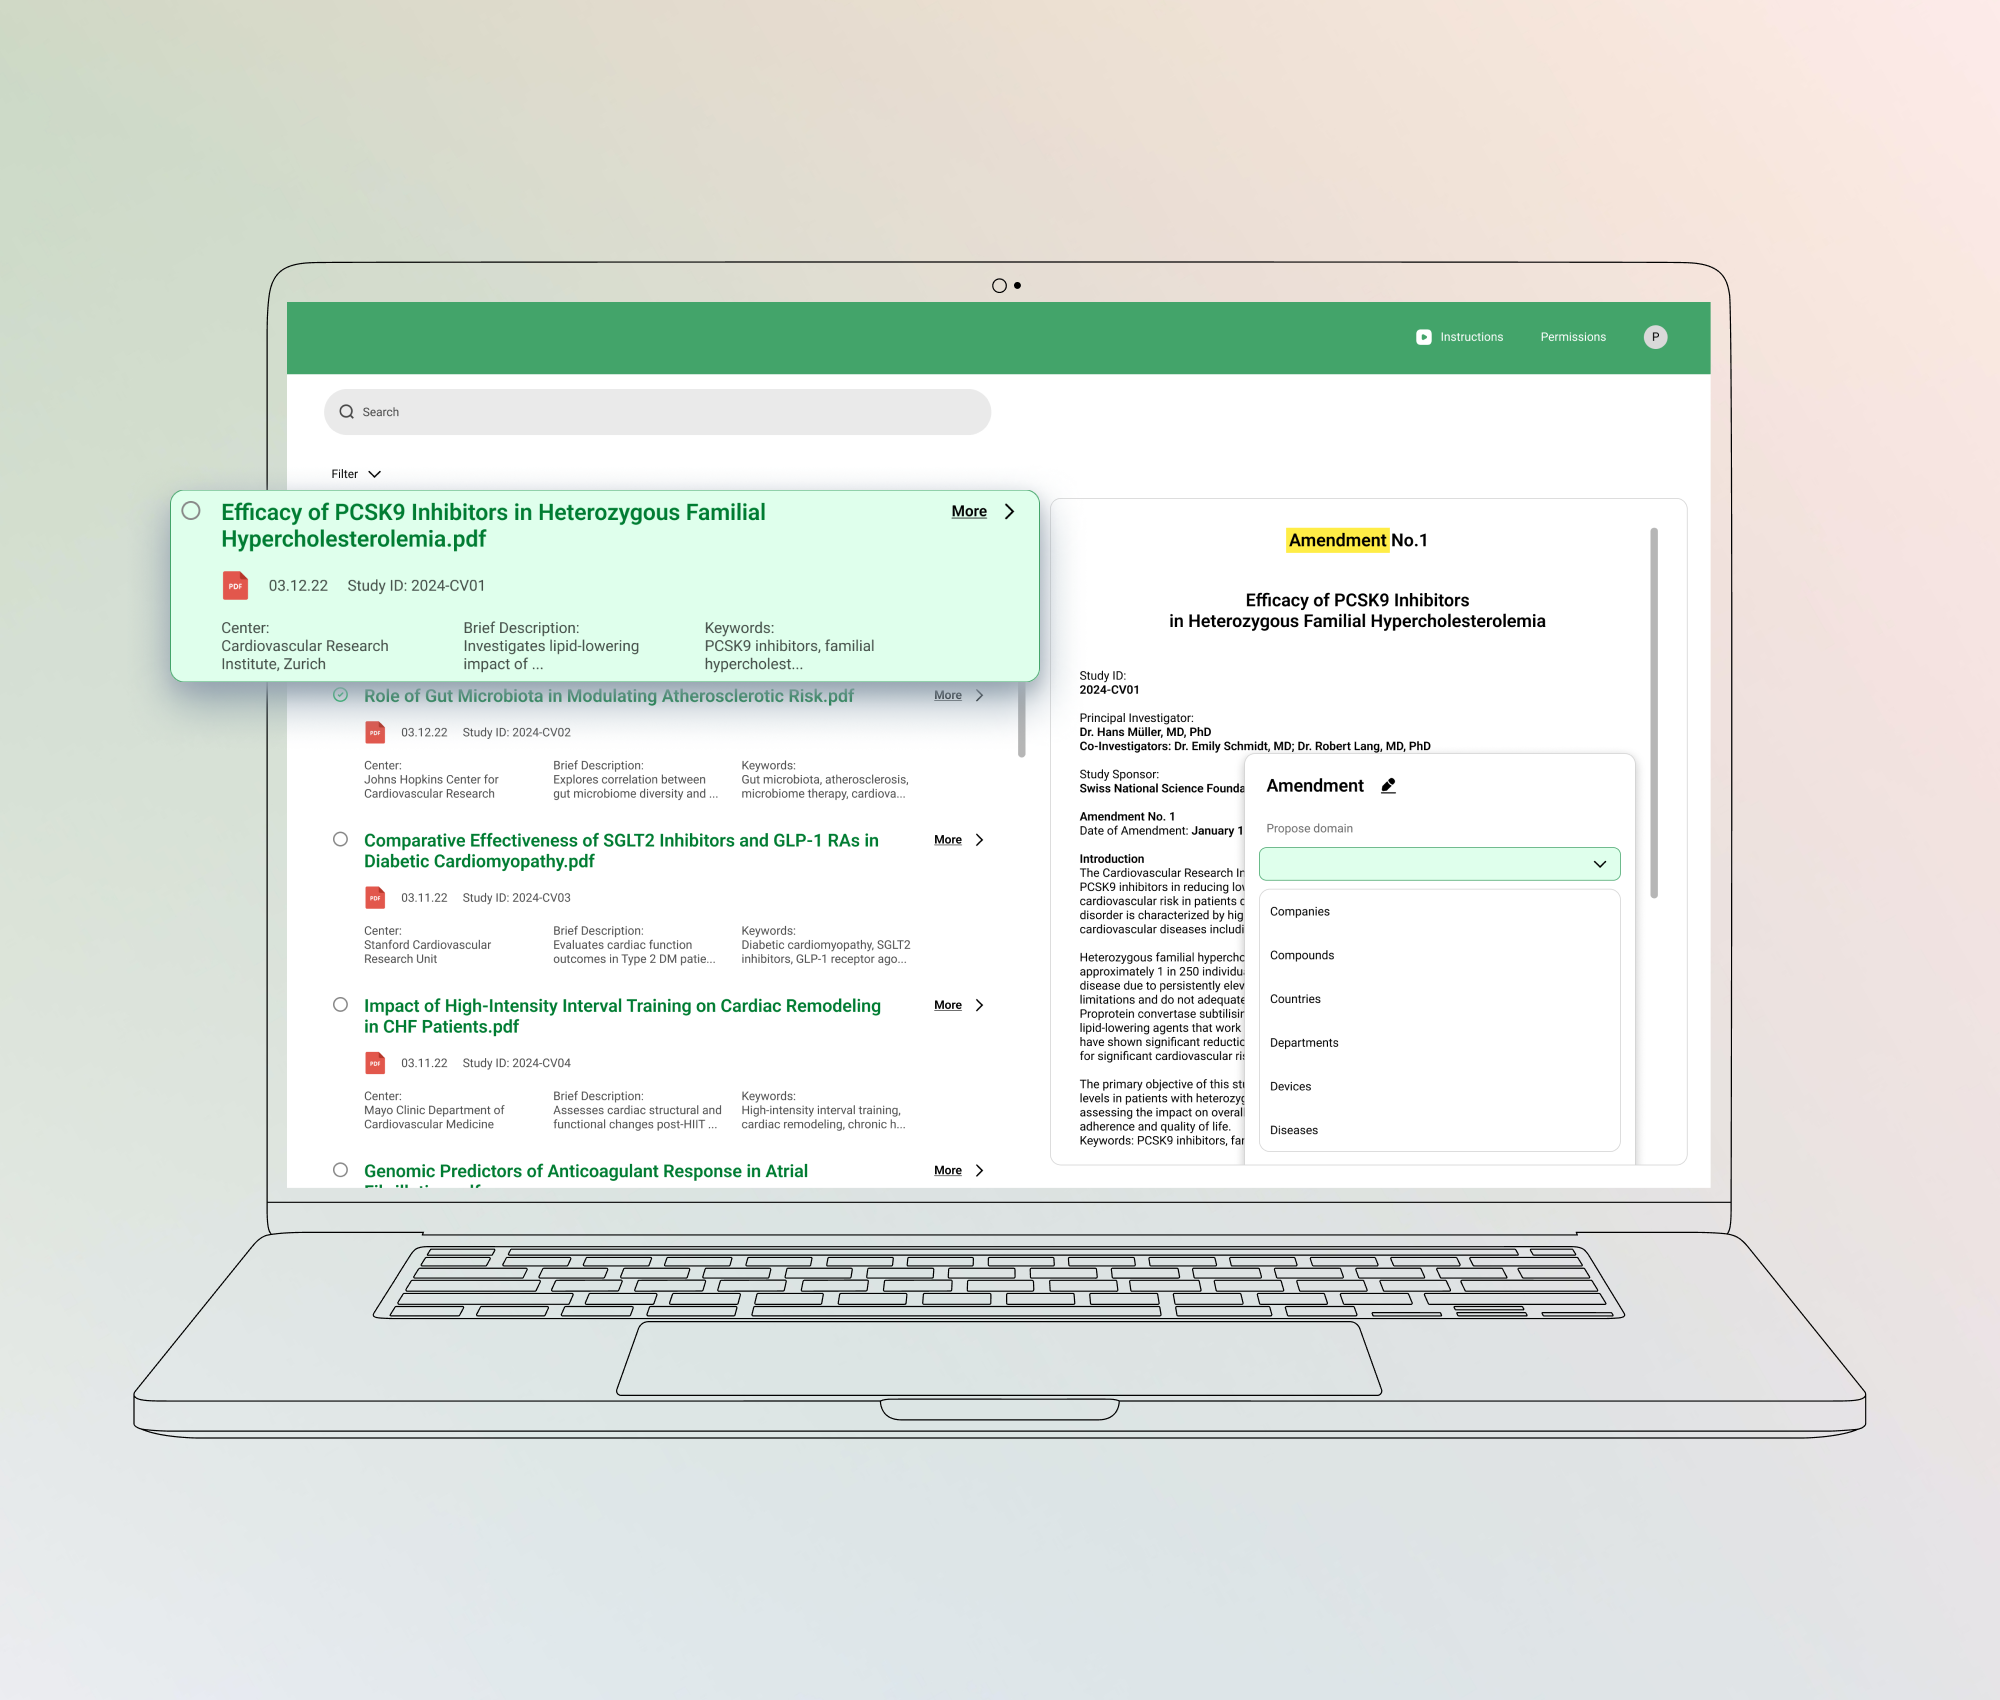
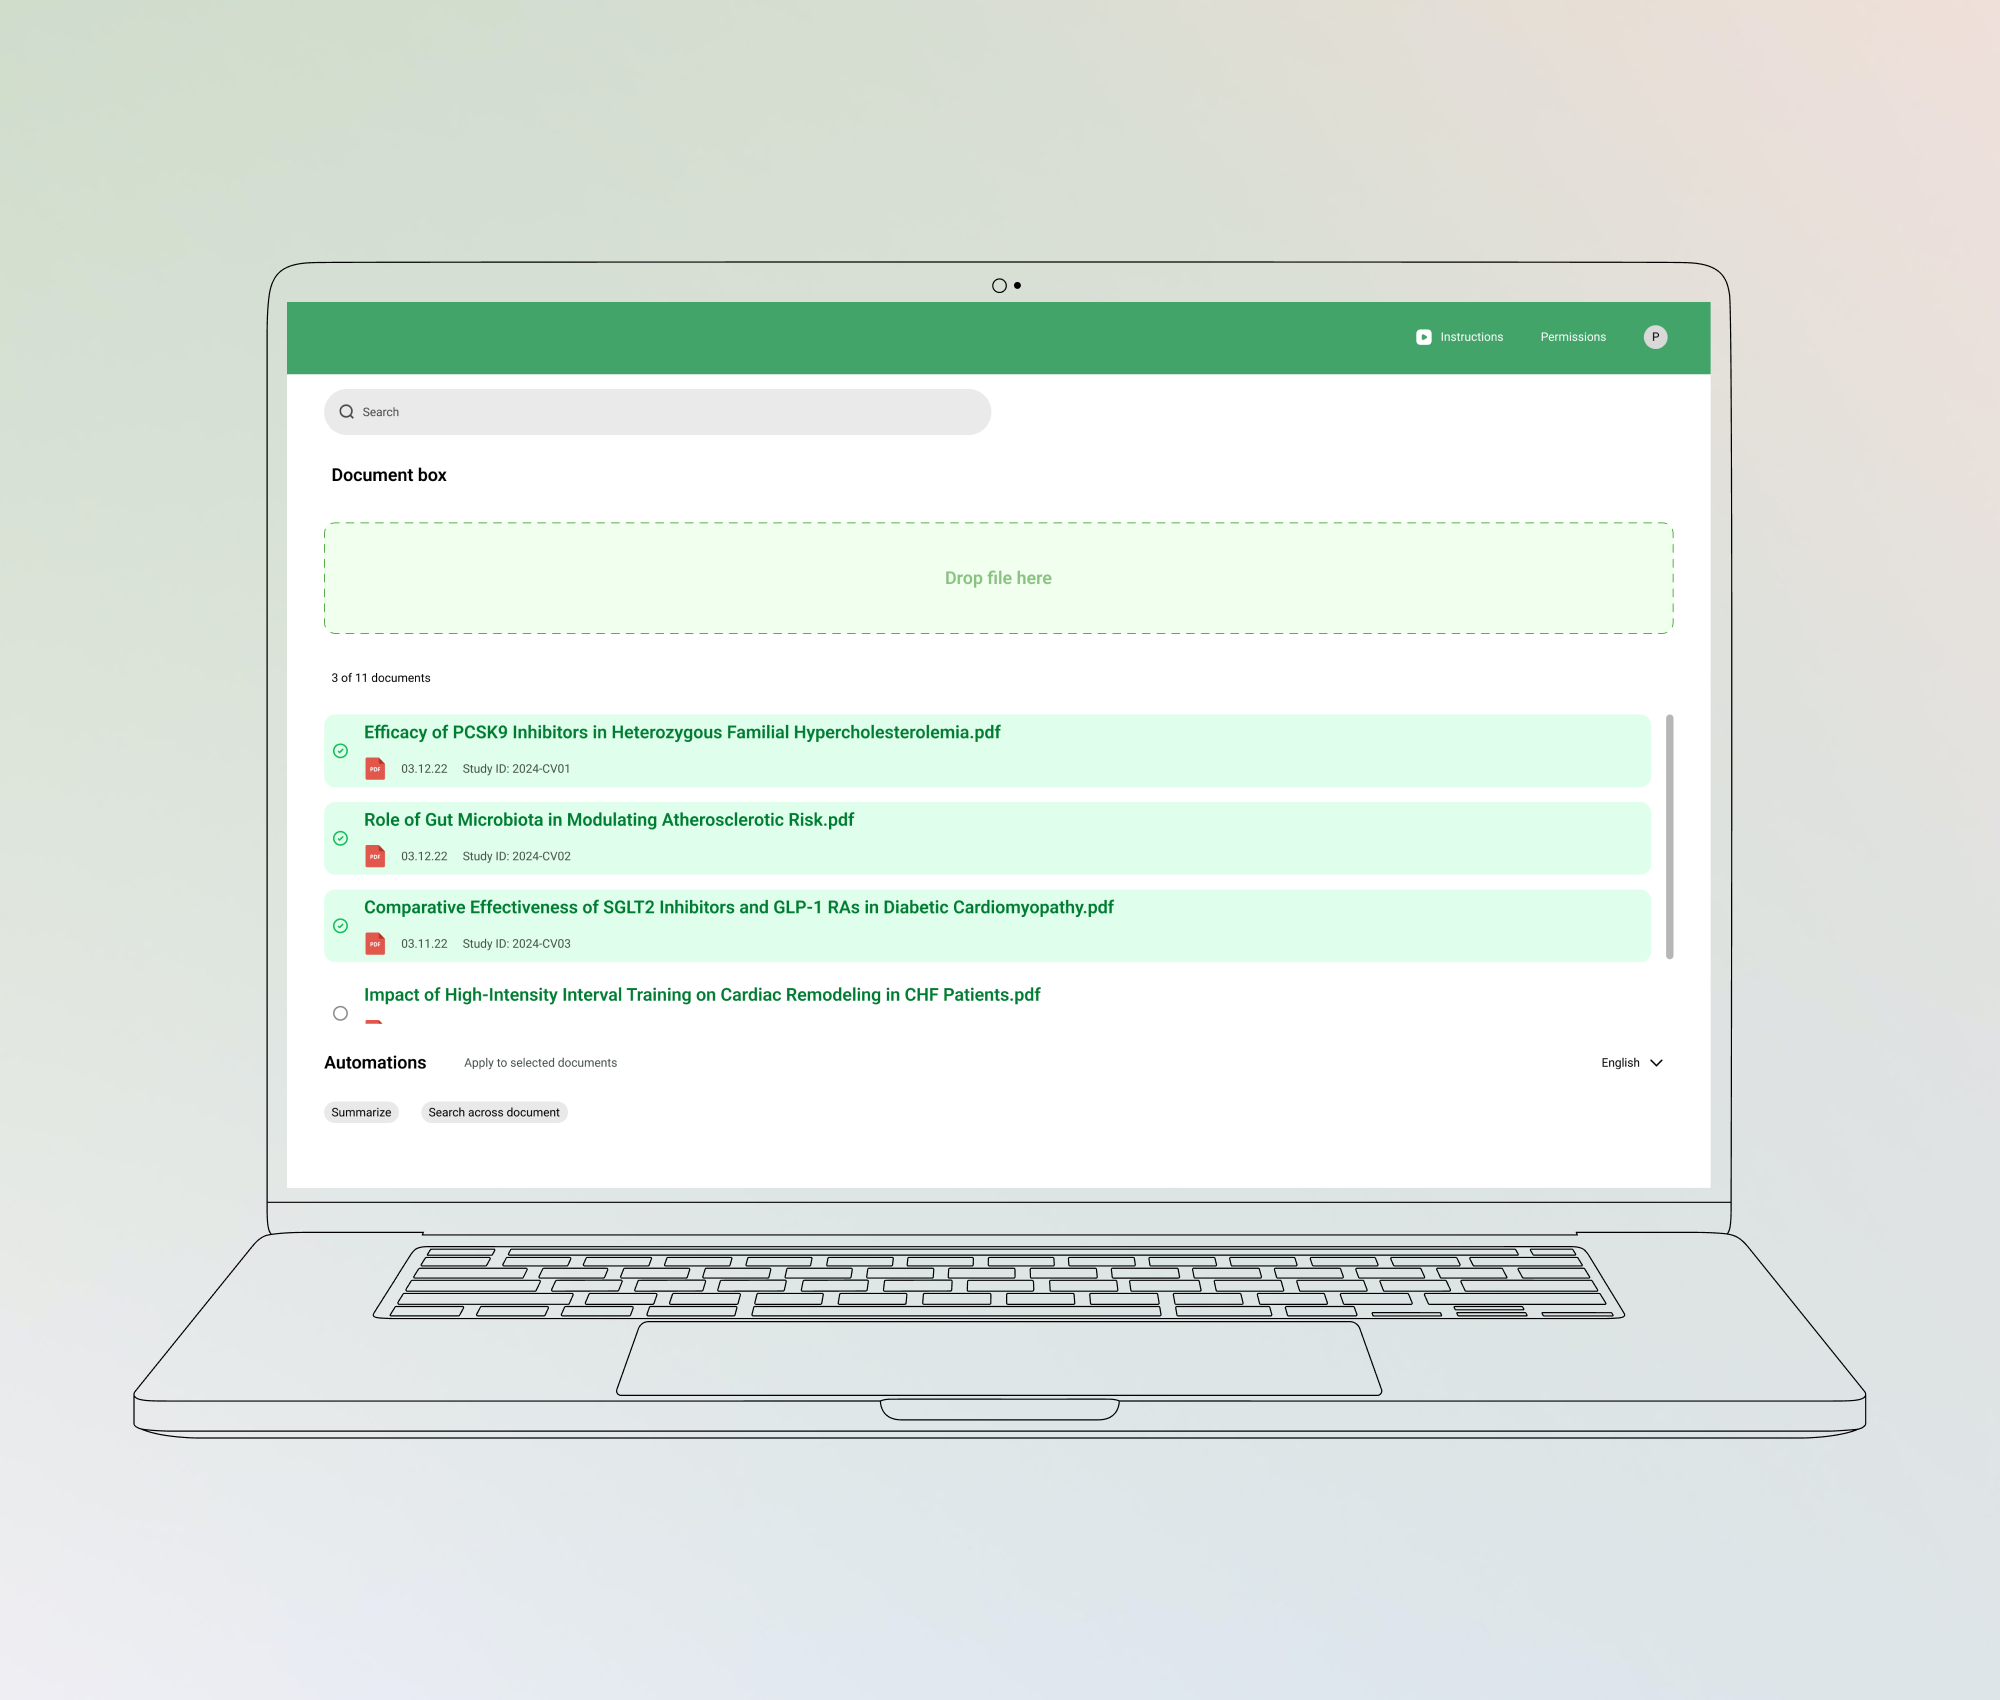
Our team focused on developing and enhancing a specialized AI-powered search system – a key subsystem within a larger framework, designed for web and mobile interfaces. This task involved multiple technical and functional improvements:
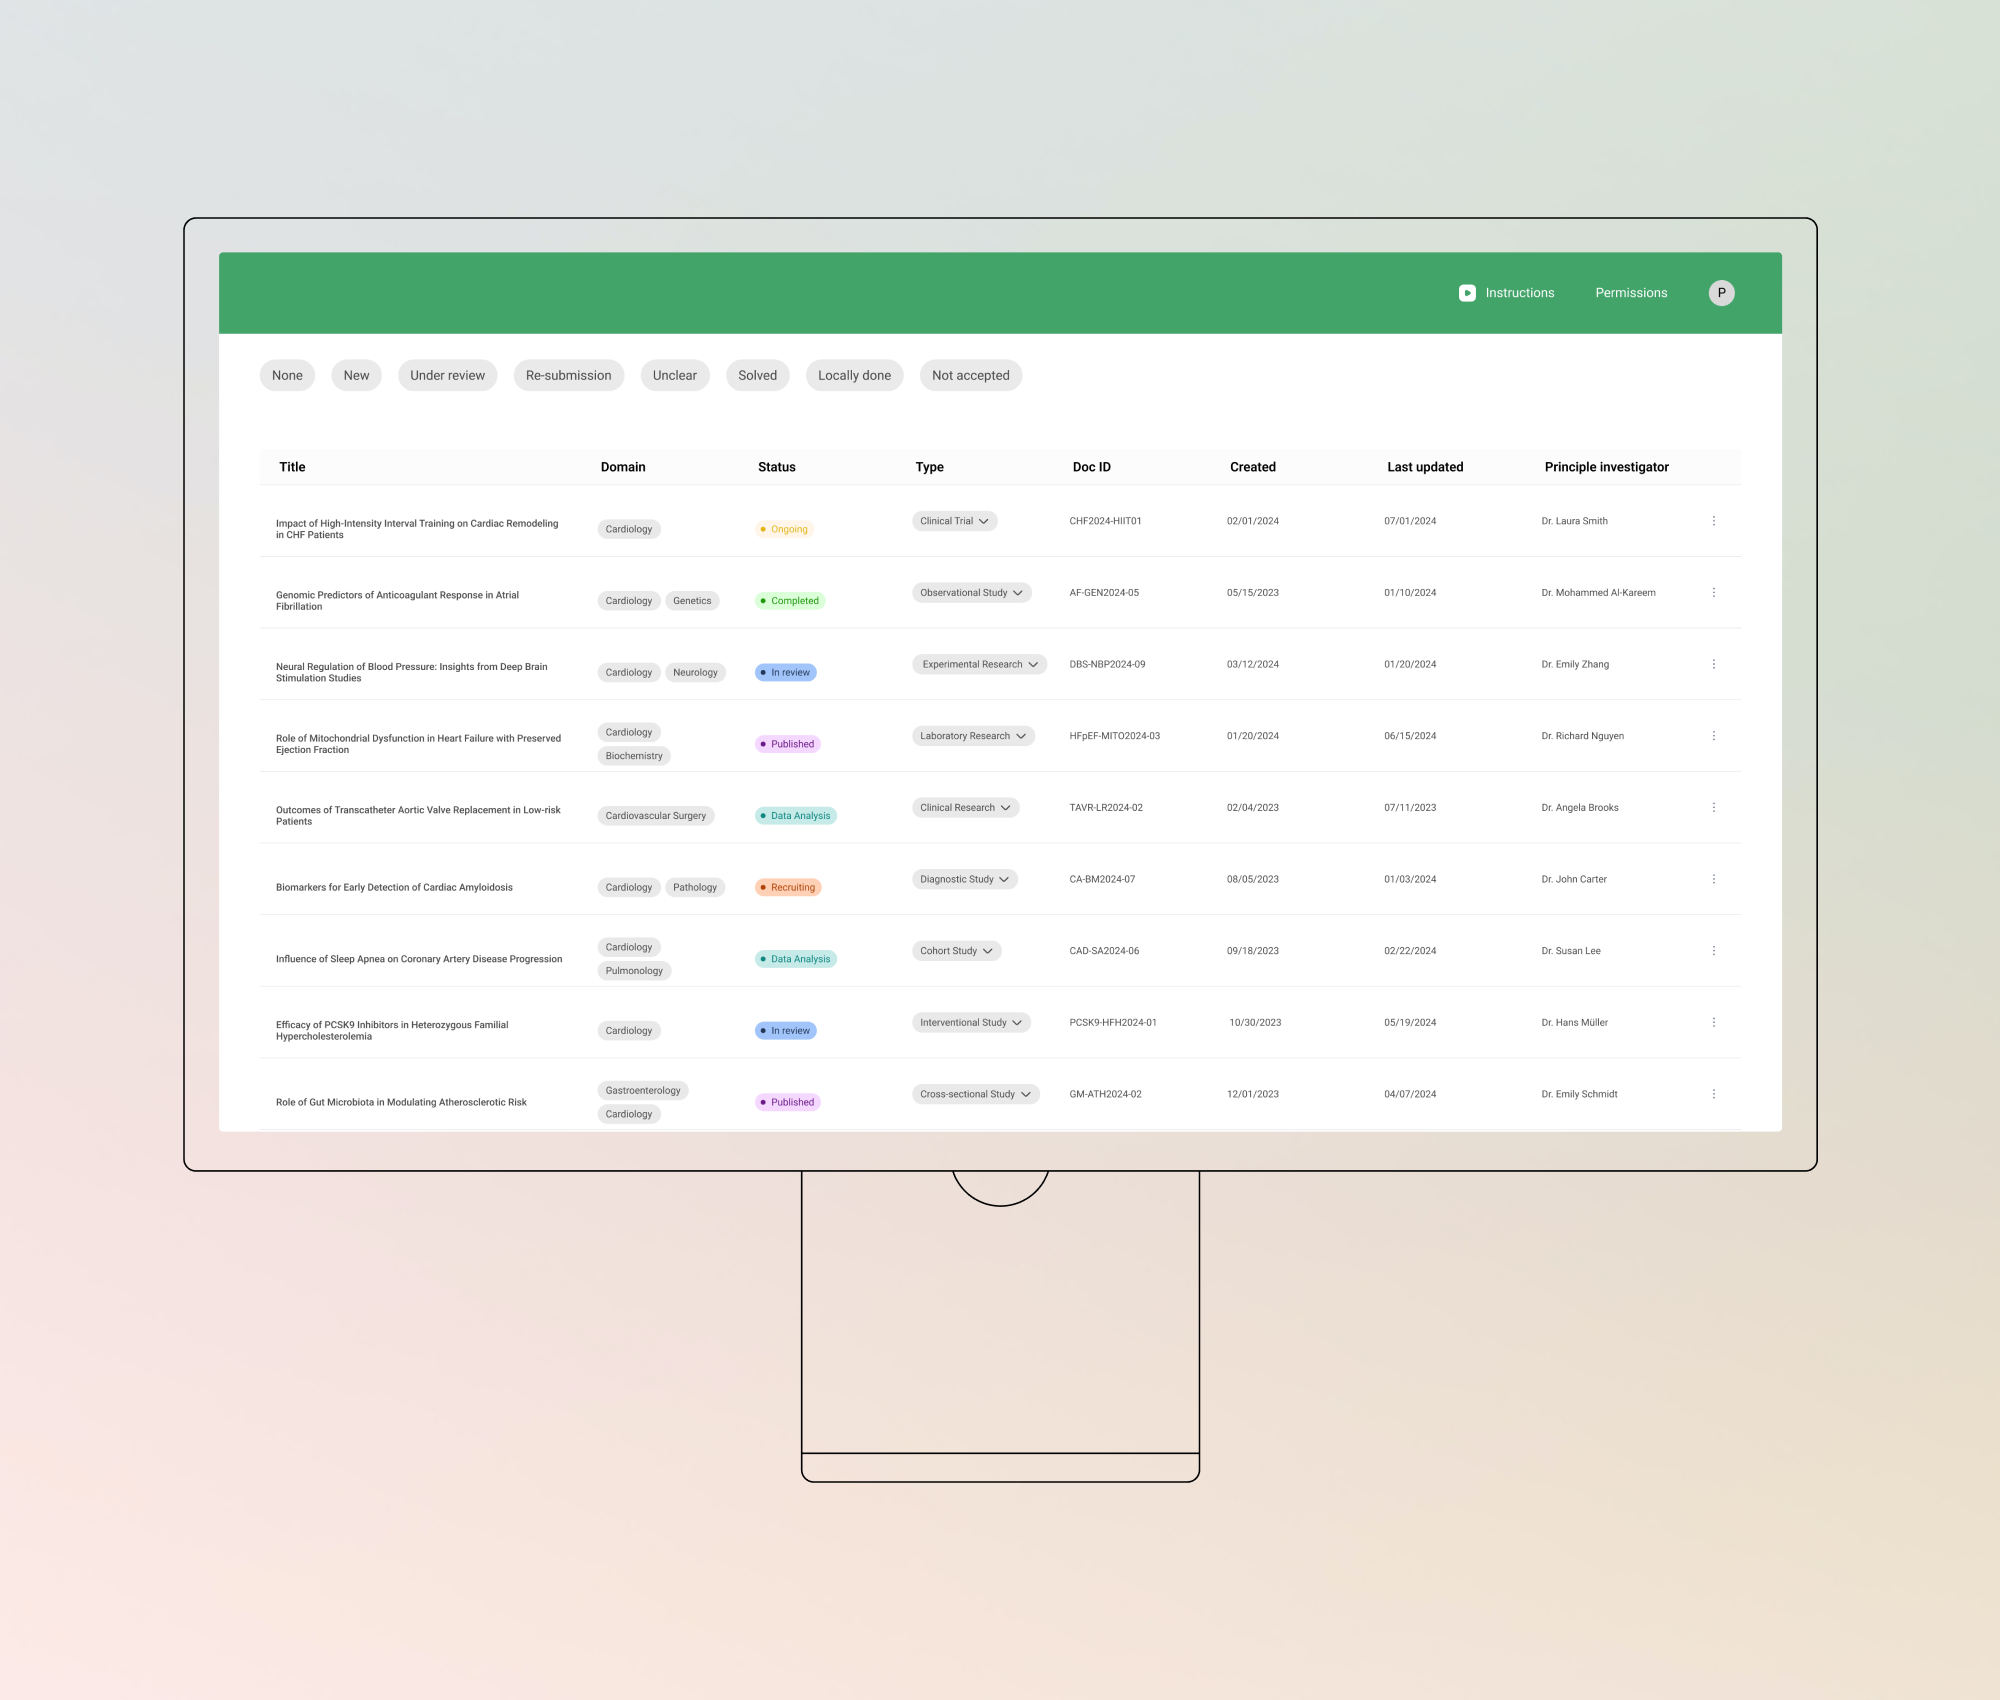
Our data science team focused on automating data visualization through dashboards, a crucial component for the client’s research in identifying molecular targets for new pharmaceutical treatments. The primary diseases under study included obesity and muscle diseases.
Dashboard creation: The team’s objective was to create dashboards for visualizing pharmaceutical data. This involved processing large datasets, which are a vast number of annotated medical articles with unique ID and metadata, to form sizable GBQ tables.
Data visualization: Using Looker Studio, we transformed these large data tables into smaller, more manageable formats for dashboard creation. This visualization step was necessary for experts to better review and filter data.
Dashboard automation: Post-approval by medical experts, we automated the dashboard creation using data engineering techniques. This involved using repositories containing SQL scripts to fetch required information. These scripts were scheduled to run at specific intervals, ensuring the dashboards remained up-to-date with the latest research findings.
Continuous updates and integration: Our solution allowed for the continuous integration of new relevant publications into the dashboards. This dynamic updating process was facilitated by Google Cloud Functions. It kept dashboards updated with the most recent data.
Query management: We handled queries through large tables, pulling out specific information based on search queries. The team then visualized these statistics in the dashboards and identified any issues in the search queries.
Our project focused on integrating our client’s ontologies into an established lab management software at a chemical research company. This task involved several key steps to modernize and automate their outdated system:
Programming languages
JavaScript, TypeScript, Java
Front-end
React, react-pdf, Redux, Redux-thunk, React-redux, Primereact, SASS, Lodash, Axios, FileSaver, GPT-Tokenizer
Back-end
Spring Boot, Java with Lucene Libraries, Stardog
Data science and analytics
Python (Pandas, Numpy, Plotly, Matplotlib), GCP (Google Big Query, Google Cloud Storage, Cloud Run), Looker, Data Studio, Apache Solr, custom tools for data processing and visualization
Our approach to the development process was methodical and adhered to Agile principles, which ensured flexibility and continuous improvement.
At the beginning, we conducted thorough research to understand the client’s needs and existing systems to deliver a detailed ‘Vision and Scope’ document. Based on the initial findings, we proceeded to design and develop the necessary features for each stream. Our team held regular sprint meetings to confirm that our work aligned with client expectations. All features were implemented and subjected to rigorous testing for performance and accuracy, with the client providing continuous feedback.
For effective communication and project tracking, we utilized Microsoft tools and Monday.com, ensuring a transparent process and real-time updates.
1
Project Manager
3
React Developers
3
Java Developers
1
ML/Python Developer
2
Data Engineers
In our collaborative effort with the client, spanning three key streams, we’ve made significant strides in advancing their scientific research capabilities. Here’s a snapshot of the actual results:
60%
reduction in manual data handling
3x
speed increase in data search
50%
faster annotation process
Having received and processed your request, we will get back to you shortly to detail your project needs and sign an NDA to ensure the confidentiality of information.
After examining requirements, our analysts and developers devise a project proposal with the scope of works, team size, time, and cost estimates.
We arrange a meeting with you to discuss the offer and come to an agreement.
We sign a contract and start working on your project as quickly as possible.
© 2007-2024 Innowise. All Rights Reserved.
Privacy Policy. Cookies Policy.
Innowise Sp. z o.o Ul. Rondo Ignacego Daszyńskiego, 2B-22P, 00-843 Warsaw, Poland
By signing up you agree to our Privacy Policy, including the use of cookies and transfer of your personal information.
Thank you!
Your message has been sent.
We’ll process your request and contact you back as soon as possible.
Thank you!
Your message has been sent.
We’ll process your request and contact you back as soon as possible.