The form has been successfully submitted.
Please find further information in your mailbox.

Our customer is one of the most prominent financial institutions, providing grants and loans to key public and private projects. With more than 100 branches around the globe, they offer sustainable solutions that aim to decrease poverty by carrying out capital projects.
Detailed information about the client cannot be disclosed under the provisions of the NDA.
Since the foundation, our customer has supervised thousands of financial, social, energetic, educational, environmental, and other projects, partnering with governments and international corporations. They aim to reduce poverty, increase shared prosperity, and promote sustainable development by funding key projects of strategic importance.
Although our customer had a clear and thorough workflow and data presentation, they faced challenges analyzing and assessing textual information. Rather than using interactive map data visualization for data analysis, they relied on multi-page reports, often making informed decisions difficult.
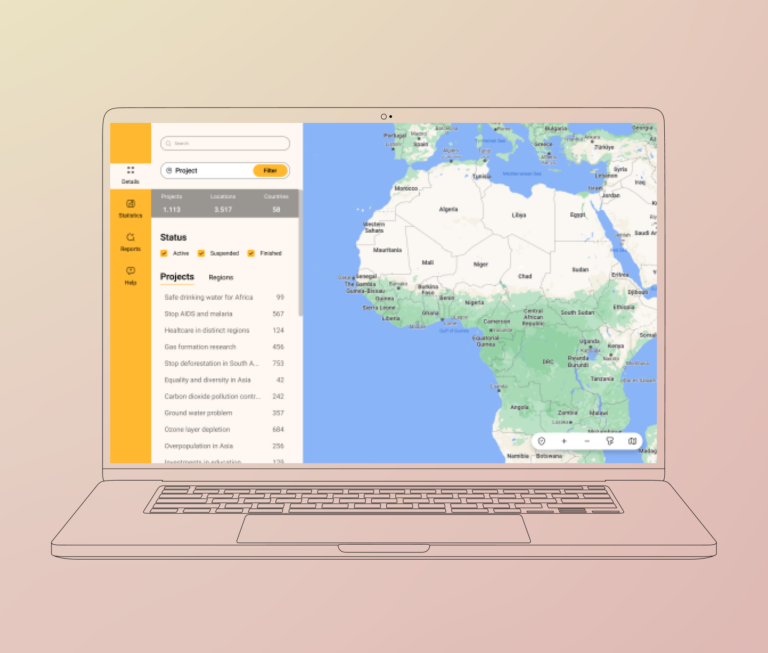
Having a multi-faceted global project portfolio, our client sought a scalable, interactive, and customizable solution with geographical maps to help clients quickly review brief details about current projects and gain insights across areas of interest, including regions, countries, and custom areas.
After analyzing the customer’s request, Innowise suggested developing an SVG (scalable vector graphics) map. Unlike pixel-based maps, SVG maps use mathematical equations to define map elements, which enables seamless scaling up and down without any loss in quality.
As for location data visualization, popular choices include libraries like Google Maps and Open Street Maps. SVG maps, however, are lightweight, customizable, and license-free, so they are a good choice when neither high resolution nor scrupulous detail is required.
After settling on a solution, our project team progressed through several subsequent phases to deliver interactive SVG maps.
FIRST-LEVEL ADMINISTRATIVE DIVISIONS
Before diving deeper into the core logic, Innowise clarified the main entities an SVG map illustrates. Besides establishing the correct geographical borders of the countries, we also had to ensure precise and up-to-date administrative-territorial divisions. As an example, different countries are divided into various administrative divisions, such as states in the US, provinces in Canada, and regions in France.
Consequently, we aimed to gather accurate map data from Natural Earth that reflects these regional administrative variances. Natural Earth is a free map repository that provides both raster and vector data at scales of 1:10m, 1:50m, and 1:110 million, and serves as a suitable base template for creating visually appealing and expertly crafted digital maps using GIS software.
FROM SHP TO SVG
After choosing suitable map templates, our project team converted original multiformat shapefiles (SHP) into scalable vector graphics. These graphics provided paths to each administrative division and were represented by an SVG file, which is an XML file that contains geometrical objects such as circles, lines, squares, and more. These objects were embedded as SVG tags, which ensured that the images remained smooth and proportional.
PYTHON SCRIPT
Although each entity in the SVG file has its own path tag, organizing the data systematically would be more efficient in meeting project requirements. We sorted the SVG file data alphabetically by country and administrative division using a Python script. This resulted in a dataset that contained over 4500 first-level administrative divisions located in 153 countries across the globe where the customer either has ongoing projects or plans to invest funds.
FROM CODE REFACTORING TO PROGRESSIVE WEB APP
After uploading the SVG map data for compilation, the file size exceeded 16 MB of pure text. Since meticulous digitalization would cause freezes, glitches, and other performance issues, our specialists decided to use Javascript to turn the interactive map into a progressive web application. Therefore, our project team incorporated the SVG files in the HTML markup. However, since the code exceeded 4500 lines, our software engineers added inline frames ( HTML elements that load another HTML page within the document) and a separate HTML file containing SVG. This helped to optimize the system load and ensure smooth performance. Additionally, we built a local server to allow cross-origin requests from multiple users.
USER INTERFACE
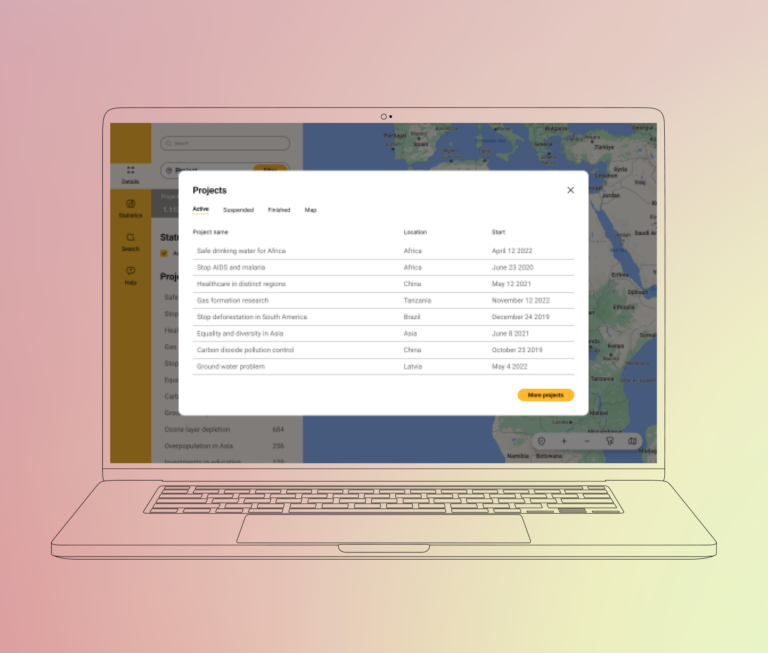
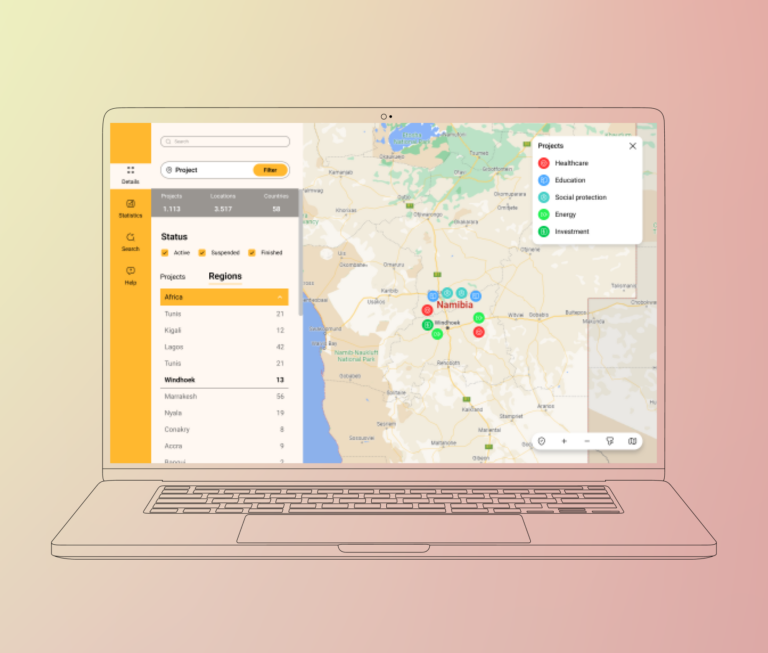
Furthermore, our project team created a user-friendly interface for easy map navigation. We colored the map, specifying shades depending on the number of projects in a particular country. Also, our developers built convenient filters for searching specific projects, highlighting regions based on the project status (active, closed, suspended). The projects are categorized according to their purposes (social protection, health, agriculture, energy, etc.), countries of application, and cumulative cost. After specifying the projects, users can download PDF reports to learn more about them.
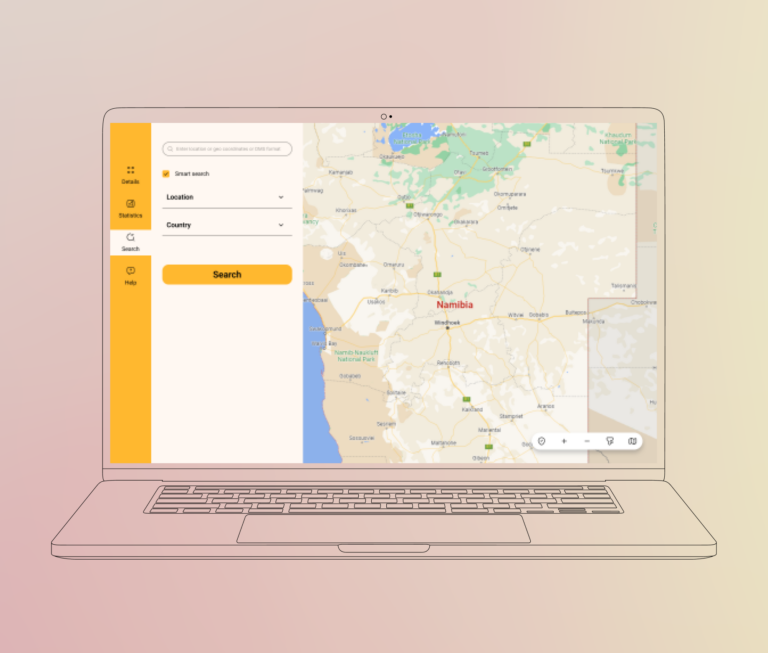
Overall, Innowise has implemented such features as map backgrounds (topographic, imagery with labels, and others), map configuration (default 2D or table form), advanced search capabilities (based on location name or geo coordinates in decimal degrees/DMS format), and zoom in/out options.
Throughout the business mapping software development process, Innowise adhered to agile approaches and aligned with the customer’s needs. The project team followed the Scrum methodology with weekly sprints, daily team meetings, and continuous integration and testing. By communicating with the client via Microsoft Teams, we easily accommodated changes in the scope and distributed tasks according to team members’ competencies.
Following the project vision, we launched a full-fledged MVP with basic functionality. Currently, the client is considering adding new features and integrating the SVG map with external services, with our team providing post-launch support and maintenance.
Innowise has developed business map software to monitor information about customer’s project around the globe. We have delivered a one-stop platform where the client can manage ongoing projects, sort them by various factors, and access project details. The beautiful SVG maps we have developed offer the customer multiple benefits, such as:
500+
projects across 150 countries
230%
increase in geo data efficiency
Having received and processed your request, we will get back to you shortly to detail your project needs and sign an NDA to ensure the confidentiality of information.
After examining requirements, our analysts and developers devise a project proposal with the scope of works, team size, time, and cost estimates.
We arrange a meeting with you to discuss the offer and come to an agreement.
We sign a contract and start working on your project as quickly as possible.
© 2007-2024 Innowise. All Rights Reserved.
Privacy Policy. Cookies Policy.
Innowise Sp. z o.o Ul. Rondo Ignacego Daszyńskiego, 2B-22P, 00-843 Warsaw, Poland
By signing up you agree to our Privacy Policy, including the use of cookies and transfer of your personal information.
Thank you!
Your message has been sent.
We’ll process your request and contact you back as soon as possible.
Thank you!
Your message has been sent.
We’ll process your request and contact you back as soon as possible.