The form has been successfully submitted.
Please find further information in your mailbox.

The customizable system integrates all the data about the production process into an easy-to-use web application, making cost analysis and planning of different scenarios much easier.
The client provides complex ERP systems for large enterprises, as well as audit and consulting services for manufacturing companies, helping them to optimize their work and financial statements.
Detailed information about the client cannot be disclosed under the provisions of the NDA.
Analysts of the client used to calculate all the costs and expenditures of different factories in cumbersome Excel spreadsheets. The more data were in the tables, the slower the program worked. Moreover, if it was necessary to add columns to the table (e.g. with new components), users had to change formulas within cells manually. That slowed down the analytical process and caused some human errors.
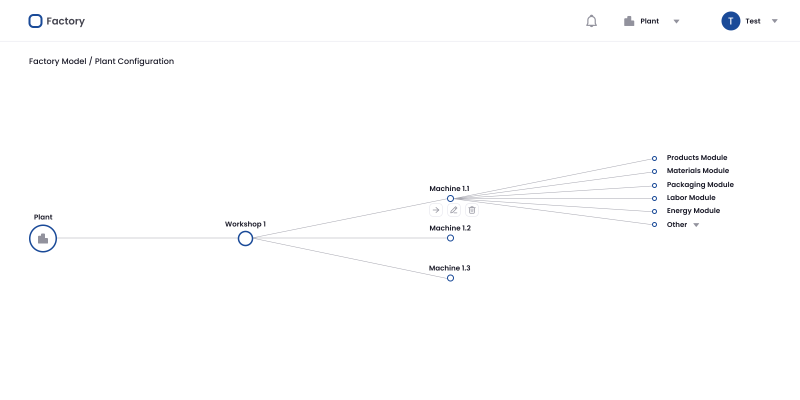
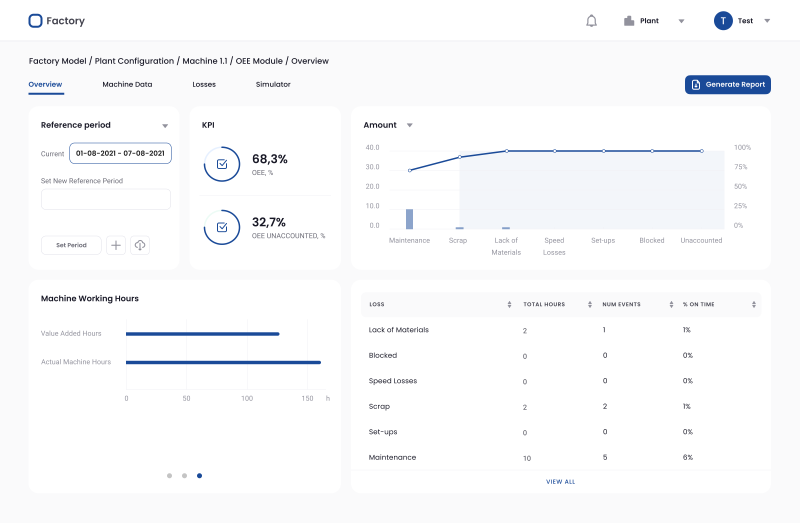
Clicking the items at the lowest level of the scheme, users open a section with accumulated information about each manufacturing unit: pages with a general overview of work and output, manufactured and defective products, materials used, losses, and labor. It is possible to set KPIs with different parameters (output, scrap, etc.) for each machine and use charts to track changes in absolute and relative terms. Analysts can check the efficiency of each machine: how many products were manufactured, at what speed, and with how many resources and losses.
COST MODULE
This part of the solution represents a dashboard with a summary of the production costs of a chosen time period. It provides accumulated data about output, total costs, costs per unit produced, etc. Users can also compare data with a reference period to track changes over time. A small P&L table gives more information on spent cost per element (labor, raw materials, energy, depreciation, etc.) in comparison to the allocated budget and percentage of losses. For clarity, all cost categories are also presented in a graph. This overview allows users to understand at a glance the weight of each category in total production costs and identify problem areas for their optimization.
To get more details about cost structure, users can plunge into the information presented in large P&L spreadsheets, which are another part of the cost module. They include more parameters of each P&L component and allow users to calculate how production costs depend on output volume, price changes over years, and losses.
INTUITIVE USER INTERFACE
The spreadsheet interface is especially easy to use: each row has a few buttons for editing data, adding a new nested row, and repeating and deleting the same row. All formulas and complicated calculations with many interrelated parameters are “hidden” in the backend, so ordinary users without admin rights won’t accidentally change or spoil them. The data can be imported from other tables (e.g. CSV, XML Spreadsheets), saving users a lot of time and minimizing manual work.
The spreadsheet configuration already provides a list of general elements which are common for different types of plants – direct and indirect labour, raw materials, packaging, energy, maintenance, quality control, operating expenses, etc. Therefore, users only need to choose required elements in settings and adapt them to their own needs: they can change names if required, insert additional lines with components, and add actual costs and prices.
SIMULATION MODULE
The next part of the cost module makes it possible to simulate top-down and bottom-up scenarios. Analysts can set reduction targets (e.g. by costs, losses) and get estimations of cost optimization by year. This helps to find the perfect combination of all parameters, allowing production companies to minimize costs at the same quality and increase their EBITDA.
When a scenario is approved, it is used as a benchmark to track the current efficiency of production. Thus, analysts can detect serious errors in the efficacy and timing and recommend on taking corrective actions.
The client had a clear vision of what the ideal analytical module should look like, so we got mock-ups of the interface and formulas to calculate the production costs. We solved the issues with everything else – software architecture, selection of the most suitable technologies and frameworks for flawless operation, frontend and backend development. Due to close cooperation of our Business Analyst with a strong financial background and the client’s analysts, together we managed to turn the complex logic of interrelations between all parameters into an efficient system of calculations on the Backend side and illustrative charts and tables on the user interface.
At this stage, our team examined the existing ERP platform of the client, dived deeply into the business processes, explored alternatives and figured out the best possible technological solution. We designed a model which outlines business entities in the system and their relationships, created a detailed plan for the development of each module and agreed with the client on the workflow.
According to the requirements, we recommended the technologies that perfectly suited the client's needs. Ngx-datatable was chosen to handle complex datasets in the form of spreadsheets. It provides all features to work with a table (sort, filter, add sub-rows, etc.) and is very flexible and light. D3.js was used for data visualizations and creating responsive chart components based on dynamic data. Thus, the information was presented in an easy and illustrative way that enabled users to understand it and make conclusions much faster. For Machine Learning we chose TensorFlow.js due to its high scalability and the possibility to use its capabilities on various devices if needed.
To make data analysis faster and more efficient, we implemented a Machine Learning algorithms module. It defines the patterns of changes in plants’ work parameters and assesses their effectiveness. The algorithms automatically receive the data from the ERP system and learn which ways were the most efficient in achieving the KPIs set for each plant, workshop or even machine. This allows the module to find trends and patterns that are not seen so easily but can be efficiently used in cost optimization. We chose TensorFlow.js due to its high scalability and the possibility to use its capabilities on various devices in the future if needed.
The Machine Learning module works within the manufacturer’s perimeter and doesn’t label or store data about any branch, plant, workshop, or machine. Only statistical data is analyzed by the ML algorithms. This means that this module is secure and can’t provide the potential intruder or insider with any vital information on the manufacturing powers and items of the client.
After agreement of the work breakdown structure with the client, we got down to developing the MVP.
We delivered module by module every two weeks, discussed tasks in Slack and had weekly videoconferences in Google Meets.
Each development phase concluded with the unit and manual testing, so we could detect and fix even the smallest bugs at the earliest possible stage, preventing them from turning into issues.
After agreement of the work breakdown structure with the client, we got down to developing the MVP.
We delivered module by module every two weeks, discussed tasks in Slack and had tasks tracked in Jira.
Each development phase concluded with the unit and manual testing, so we could detect and fix even the smallest bugs at the earliest possible stage, preventing them from turning into great issues.
As the system was designed from the outset to be as user-friendly as possible it took just an hour to train employees working within a new module. Results became visible within a week of implementation: the preparation of reports became 3 times faster than before, and users got more time for closer examination of data and scenario simulation. This enabled analysts to come up with a more calibrated set of findings and recommendations for each factory within a shorter period of time, thus enhancing business value and increasing customer loyalty.
Moreover, our team has managed to keep the whole ERP system as secure as it used to be before modifications were made thanks to the machine learning algorithms not interacting with any vital data while analyzing only patterns and trends that come out of certain decisions and actions.
Having received and processed your request, we will get back to you shortly to detail your project needs and sign an NDA to ensure the confidentiality of information.
After examining requirements, our analysts and developers devise a project proposal with the scope of works, team size, time, and cost estimates.
We arrange a meeting with you to discuss the offer and come to an agreement.
We sign a contract and start working on your project as quickly as possible.
By signing up you agree to our Terms of Use and Privacy Policy, including the use of cookies and transfer of your personal information.
© 2007-2024 Innowise. All Rights Reserved.
Privacy Policy. Cookies Policy.
Innowise Sp. z o.o Ul. Rondo Ignacego Daszyńskiego, 2B-22P, 00-843 Warsaw, Poland
Thank you!
Your message has been sent.
We’ll process your request and contact you back as soon as possible.
Thank you!
Your message has been sent.
We’ll process your request and contact you back as soon as possible.